## Flow Diagram: Multi-Perspective Synthetic Image Detection Process
### Overview
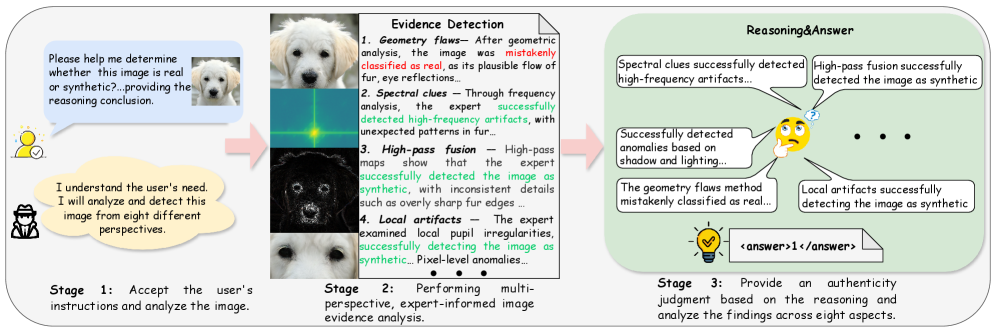
This infographic illustrates a three-stage workflow designed to determine the authenticity of an image (specifically, whether it is real or synthetic). The process moves from user input to multi-perspective evidence analysis, culminating in a synthesized reasoning and final judgment.
### Components/Axes
The diagram is organized horizontally into three distinct stages, connected by large pink arrows indicating the flow of information.
* **Stage 1 (Left):** User interaction and expert acknowledgment.
* **Stage 2 (Center):** "Evidence Detection" document containing four analytical methods.
* **Stage 3 (Right):** "Reasoning & Answer" section containing a central thinking icon, multiple reasoning bubbles, and a final output.
---
### Detailed Analysis
#### Stage 1: User Instruction
* **User Input (Top-left):** A speech bubble containing the text: "Please help me determine whether this image is real or synthetic?...providing the reasoning conclusion." It includes a small thumbnail of a puppy.
* **Expert Response (Bottom-left):** A thought bubble from an investigator icon containing the text: "I understand the user's need. I will analyze and detect this image from eight different perspectives."
#### Stage 2: Evidence Detection (Center)
This section is represented as a document page containing four numbered methods, each paired with a visual analysis snippet on the left.
1. **Geometry flaws:** "After geometric analysis, the image was **mistakenly classified as real** [text in red], as its plausible flow of fur, eye reflections..."
2. **Spectral clues:** "Through frequency analysis, the expert **successfully detected high-frequency artifacts** [text in green], with unexpected patterns in fur..."
3. **High-pass fusion:** "High-pass maps show that the expert **successfully detected the image as synthetic** [text in green], with inconsistent details such as overly sharp fur edges..."
4. **Local artifacts:** "The expert examined local pupil irregularities, **successfully detecting the image as synthetic** [text in green]... Pixel-level anomalies..."
#### Stage 3: Reasoning & Answer (Right)
This section features a central thinking emoji surrounded by five speech bubbles representing the synthesis of the evidence gathered in Stage 2.
* **Top-left bubble:** "Spectral clues successfully detected high-frequency artifacts..."
* **Top-right bubble:** "High-pass fusion successfully detected the image as synthetic"
* **Center-left bubble:** "Successfully detected anomalies based on shadow and lighting..."
* **Bottom-left bubble:** "The geometry flaws method mistakenly classified as real..."
* **Bottom-right bubble:** "Local artifacts successfully detecting the image as synthetic"
* **Bottom-center:** A lightbulb icon with the text: `<answer>1</answer>`
---
### Key Observations
* **Methodological Discrepancy:** The "Geometry flaws" method is explicitly noted as having "mistakenly classified" the image as real, highlighting that individual detection methods are prone to error.
* **Majority Consensus:** Three out of the four listed methods (Spectral clues, High-pass fusion, Local artifacts) successfully identified the image as synthetic.
* **Ensemble Reasoning:** The final stage (Stage 3) acts as an aggregator, weighing the conflicting evidence (the failure of the geometry method vs. the success of the other methods) to reach a final conclusion.
* **Binary Output:** The final answer is represented as `<answer>1</answer>`, which, in the context of the prompt, signifies "Synthetic."
---
### Interpretation
This diagram demonstrates the architecture of a robust AI-forensic system. It emphasizes that **single-point failure is a risk in AI detection**. By utilizing a "multi-perspective" approach, the system mitigates the risk of false negatives (like the geometry flaw method failing).
The inclusion of the "mistakenly classified" note is significant; it suggests that the system is designed to be transparent about its own limitations. It does not rely on a single "black box" algorithm but rather an ensemble of techniques (geometric, spectral, high-pass, and local artifact analysis). The final stage acts as a decision-making layer that synthesizes these disparate, and sometimes conflicting, data points to provide a high-confidence final judgment. This approach is essential for building trust in automated content moderation and forensic tools.