## Line Chart: Test Accuracy vs. Number of Shots
### Overview
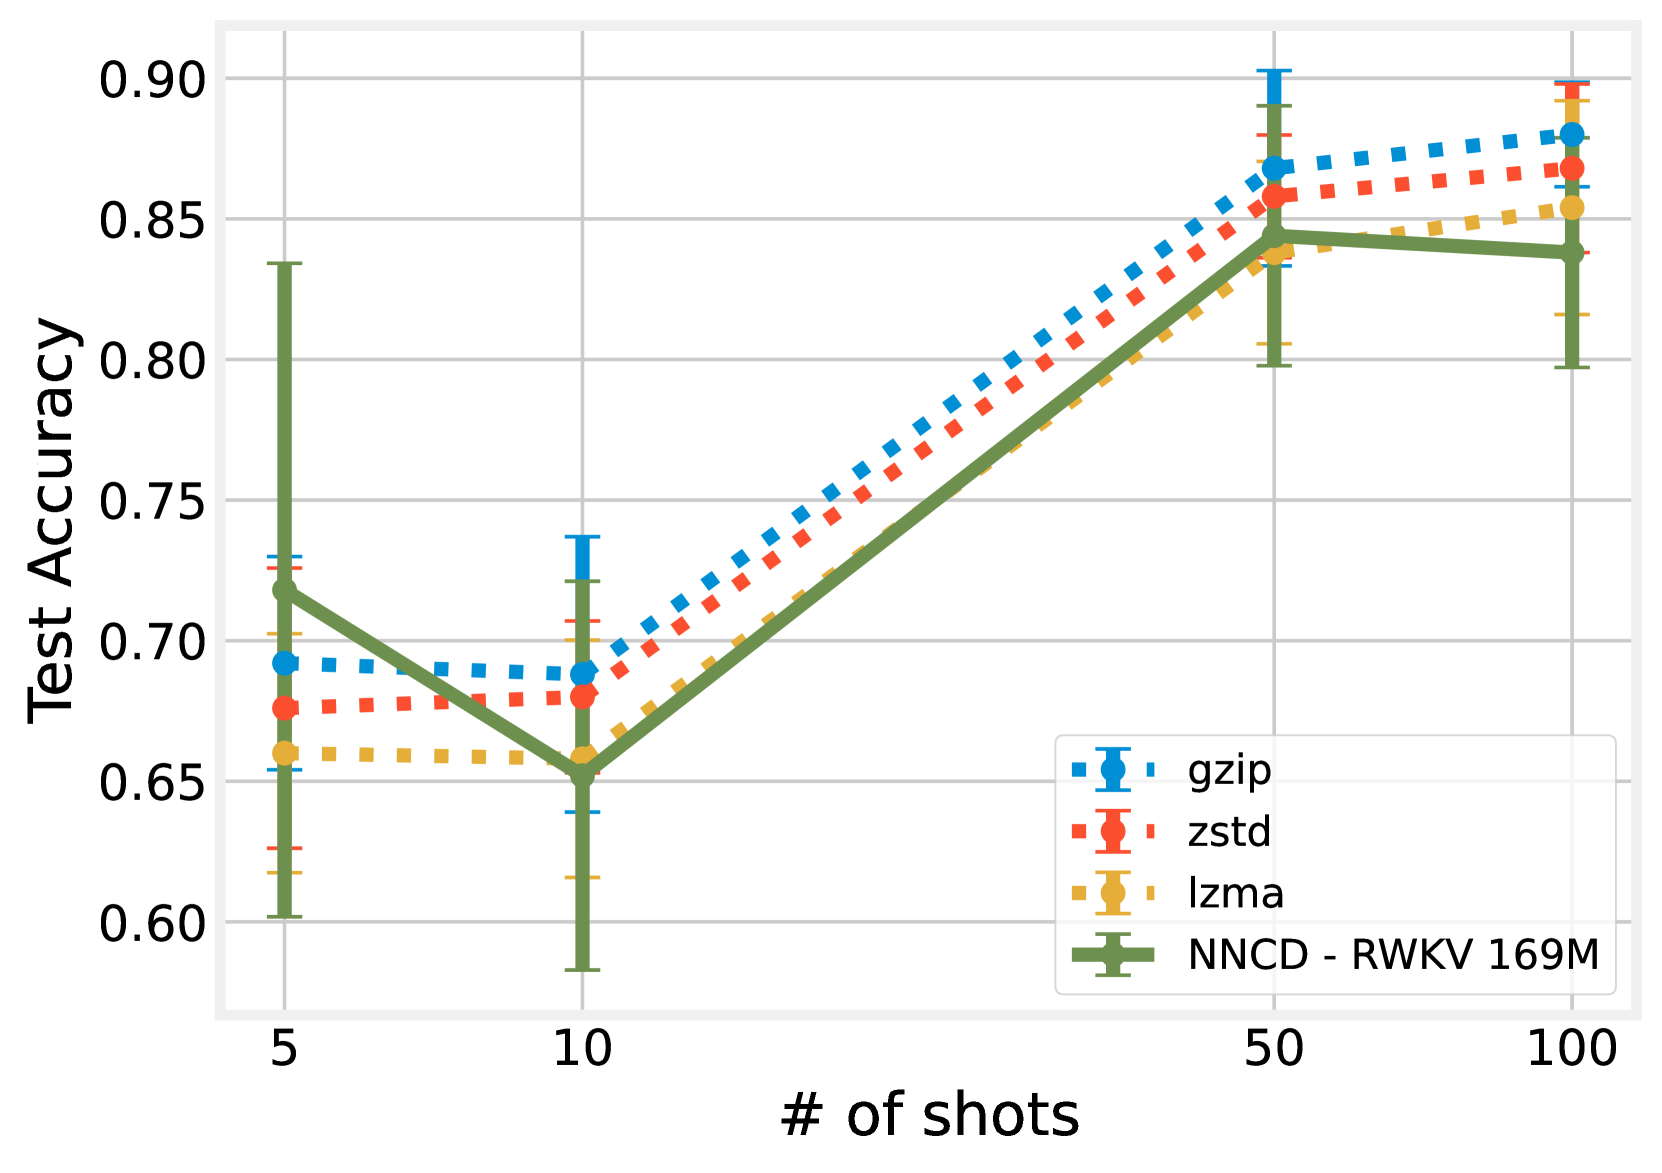
The chart compares the test accuracy of four algorithms (gzip, zstd, lzma, and NNCD - RWKV 169M) across varying numbers of shots (5, 10, 50, 100). Test accuracy is plotted on the y-axis (0.6–0.9), while the x-axis represents the number of shots. Each algorithm is represented by a distinct line style and color, with error bars indicating variability in accuracy measurements.
### Components/Axes
- **Y-Axis**: Test Accuracy (0.6–0.9, increments of 0.05).
- **X-Axis**: Number of Shots (5, 10, 50, 100).
- **Legend**: Located in the bottom-right corner, mapping colors to algorithms:
- **Blue (dashed)**: gzip
- **Red (dotted)**: zstd
- **Orange (dash-dot)**: lzma
- **Green (solid)**: NNCD - RWKV 169M
- **Markers**: Each data point is marked with a symbol (e.g., square, diamond) corresponding to its algorithm.
### Detailed Analysis
1. **gzip (Blue Dashed Line)**:
- **5 shots**: ~0.69 (±0.03 error).
- **10 shots**: ~0.68 (±0.04 error).
- **50 shots**: ~0.86 (±0.03 error).
- **100 shots**: ~0.88 (±0.02 error).
- **Trend**: Gradual improvement with more shots.
2. **zstd (Red Dotted Line)**:
- **5 shots**: ~0.67 (±0.04 error).
- **10 shots**: ~0.66 (±0.05 error).
- **50 shots**: ~0.85 (±0.03 error).
- **100 shots**: ~0.87 (±0.02 error).
- **Trend**: Steady upward trajectory.
3. **lzma (Orange Dash-Dot Line)**:
- **5 shots**: ~0.66 (±0.05 error).
- **10 shots**: ~0.65 (±0.06 error).
- **50 shots**: ~0.83 (±0.04 error).
- **100 shots**: ~0.85 (±0.03 error).
- **Trend**: Slow but consistent improvement.
4. **NNCD - RWKV 169M (Green Solid Line)**:
- **5 shots**: ~0.72 (±0.06 error).
- **10 shots**: ~0.65 (±0.05 error).
- **50 shots**: ~0.84 (±0.03 error).
- **100 shots**: ~0.84 (±0.02 error).
- **Trend**: Initial dip at 10 shots, then recovery and plateau.
### Key Observations
- **NNCD - RWKV 169M** exhibits the highest accuracy at 5 and 100 shots but shows a notable dip at 10 shots (~0.65), suggesting potential instability at intermediate shot counts.
- **gzip** and **zstd** demonstrate the most consistent improvement, with gzip achieving the highest accuracy at 100 shots (~0.88).
- **lzma** lags behind other algorithms across all shot counts but shows marginal gains at higher shot volumes.
- Error bars are largest at 5 shots (e.g., NNCD: ±0.06) and smallest at 100 shots (±0.02), indicating greater variability in low-shot scenarios.
### Interpretation
The data suggests that increasing the number of shots generally improves test accuracy for all algorithms, with diminishing returns at higher shot counts. NNCD - RWKV 169M’s performance is most erratic, with a significant drop at 10 shots that contradicts its strong performance at 5 and 100 shots. This could indicate sensitivity to specific data distributions or computational constraints at intermediate shot counts. gzip and zstd show robust scalability, while lzma’s slower improvement highlights potential inefficiencies in its compression strategy. The error bars underscore the importance of shot count in stabilizing accuracy measurements, particularly in low-data regimes.