## Scatter Plot: Reasoning Tokens vs. Problem Size for o3-mini
### Overview
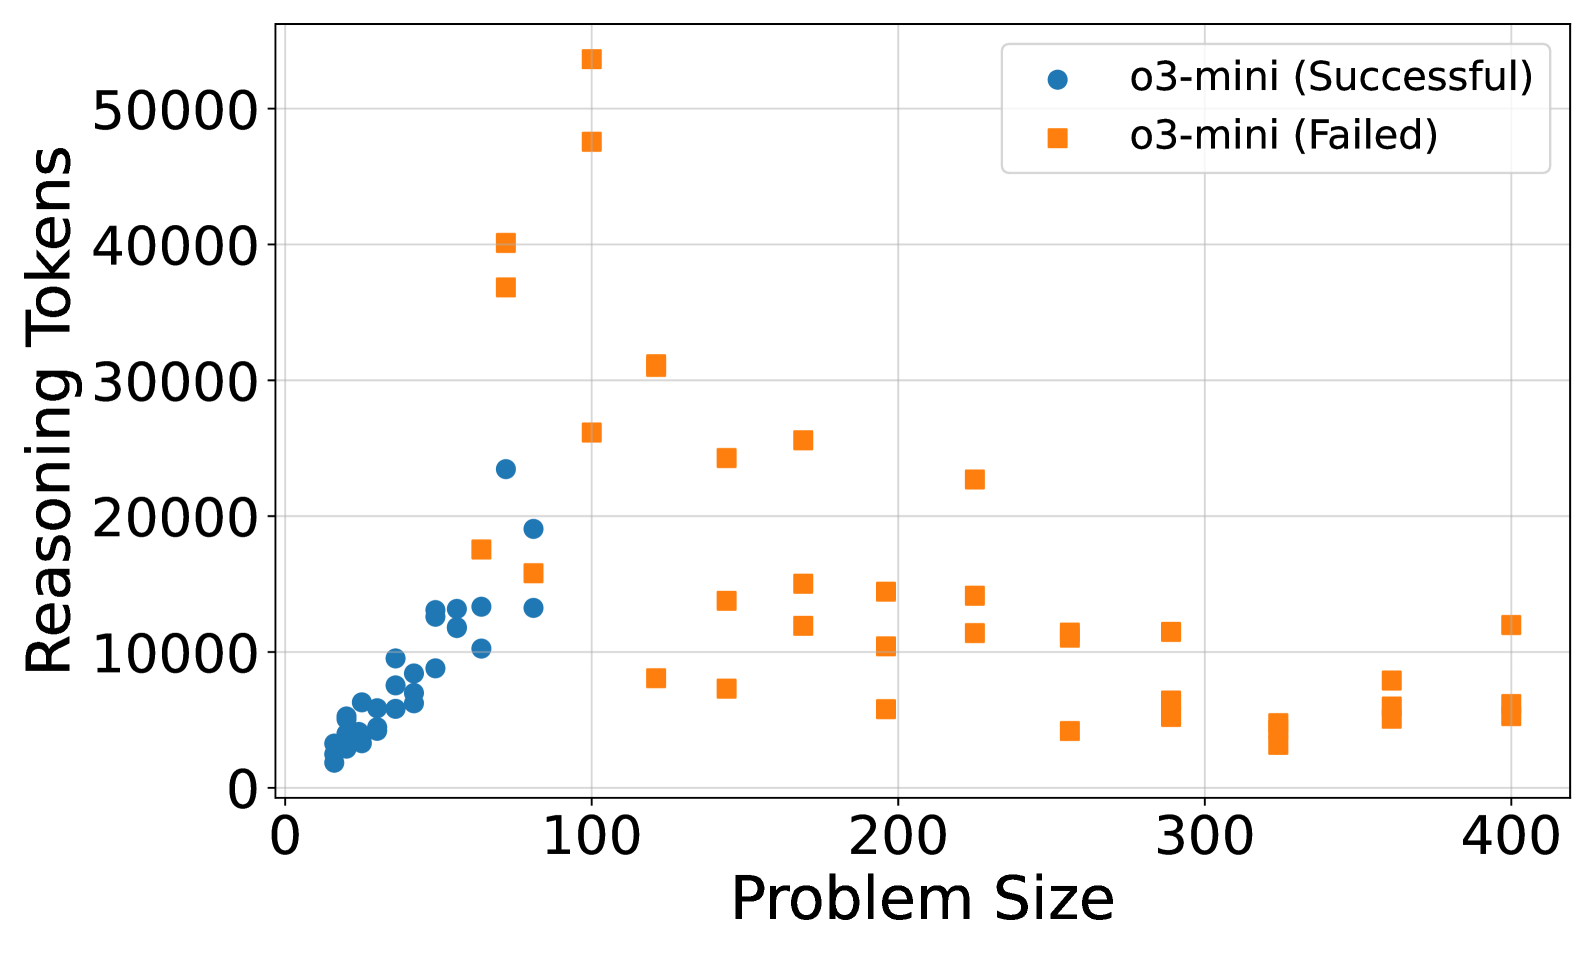
The image is a scatter plot comparing the number of reasoning tokens used by the "o3-mini" model against the problem size. The plot distinguishes between successful and failed attempts, using blue circles for successful attempts and orange squares for failed attempts. The x-axis represents the problem size, and the y-axis represents the number of reasoning tokens.
### Components/Axes
* **Title:** There is no explicit title on the chart.
* **X-axis:**
* Label: "Problem Size"
* Scale: 0 to 400, with major ticks at 0, 100, 200, 300, and 400.
* **Y-axis:**
* Label: "Reasoning Tokens"
* Scale: 0 to 50000, with major ticks at 0, 10000, 20000, 30000, 40000, and 50000.
* **Legend:** Located in the top-right corner.
* Blue circle: "o3-mini (Successful)"
* Orange square: "o3-mini (Failed)"
### Detailed Analysis
**o3-mini (Successful) - Blue Circles:**
* **Trend:** The number of reasoning tokens generally increases with problem size for successful attempts.
* **Data Points:**
* Problem Size ~10, Reasoning Tokens ~2000
* Problem Size ~20, Reasoning Tokens ~3000
* Problem Size ~30, Reasoning Tokens ~4000
* Problem Size ~40, Reasoning Tokens ~6000
* Problem Size ~50, Reasoning Tokens ~8000
* Problem Size ~60, Reasoning Tokens ~9000
* Problem Size ~70, Reasoning Tokens ~12000
* Problem Size ~80, Reasoning Tokens ~13000
* Problem Size ~90, Reasoning Tokens ~23000
**o3-mini (Failed) - Orange Squares:**
* **Trend:** For failed attempts, the number of reasoning tokens initially increases with problem size, but then appears to decrease or plateau as the problem size increases beyond approximately 100.
* **Data Points:**
* Problem Size ~20, Reasoning Tokens ~3000
* Problem Size ~40, Reasoning Tokens ~8000
* Problem Size ~60, Reasoning Tokens ~18000
* Problem Size ~80, Reasoning Tokens ~40000
* Problem Size ~100, Reasoning Tokens ~48000
* Problem Size ~120, Reasoning Tokens ~8000
* Problem Size ~140, Reasoning Tokens ~25000
* Problem Size ~160, Reasoning Tokens ~14000
* Problem Size ~180, Reasoning Tokens ~10000
* Problem Size ~200, Reasoning Tokens ~12000
* Problem Size ~220, Reasoning Tokens ~11000
* Problem Size ~260, Reasoning Tokens ~4000
* Problem Size ~280, Reasoning Tokens ~6000
* Problem Size ~300, Reasoning Tokens ~11000
* Problem Size ~380, Reasoning Tokens ~8000
* Problem Size ~400, Reasoning Tokens ~12000
### Key Observations
* For successful attempts, there is a clear positive correlation between problem size and the number of reasoning tokens.
* For failed attempts, the relationship is more complex. Initially, the number of reasoning tokens increases with problem size, but beyond a certain point (around 100), the number of tokens used in failed attempts appears to decrease or plateau.
* There is a significant difference in the number of reasoning tokens used between successful and failed attempts for smaller problem sizes.
### Interpretation
The data suggests that for the "o3-mini" model, successful problem-solving generally requires more reasoning tokens as the problem size increases. However, when the model fails, it may be due to an inefficient use of reasoning tokens, especially for larger problem sizes. The plateau or decrease in reasoning tokens for failed attempts at larger problem sizes could indicate that the model is either giving up early or getting stuck in a loop, failing to explore the solution space effectively. The model may be more likely to fail when the problem size is larger, and the number of reasoning tokens is lower. This could be due to the model not having enough resources to solve the problem.