\n
## Scatter Plot: Reasoning Tokens vs. Problem Size
### Overview
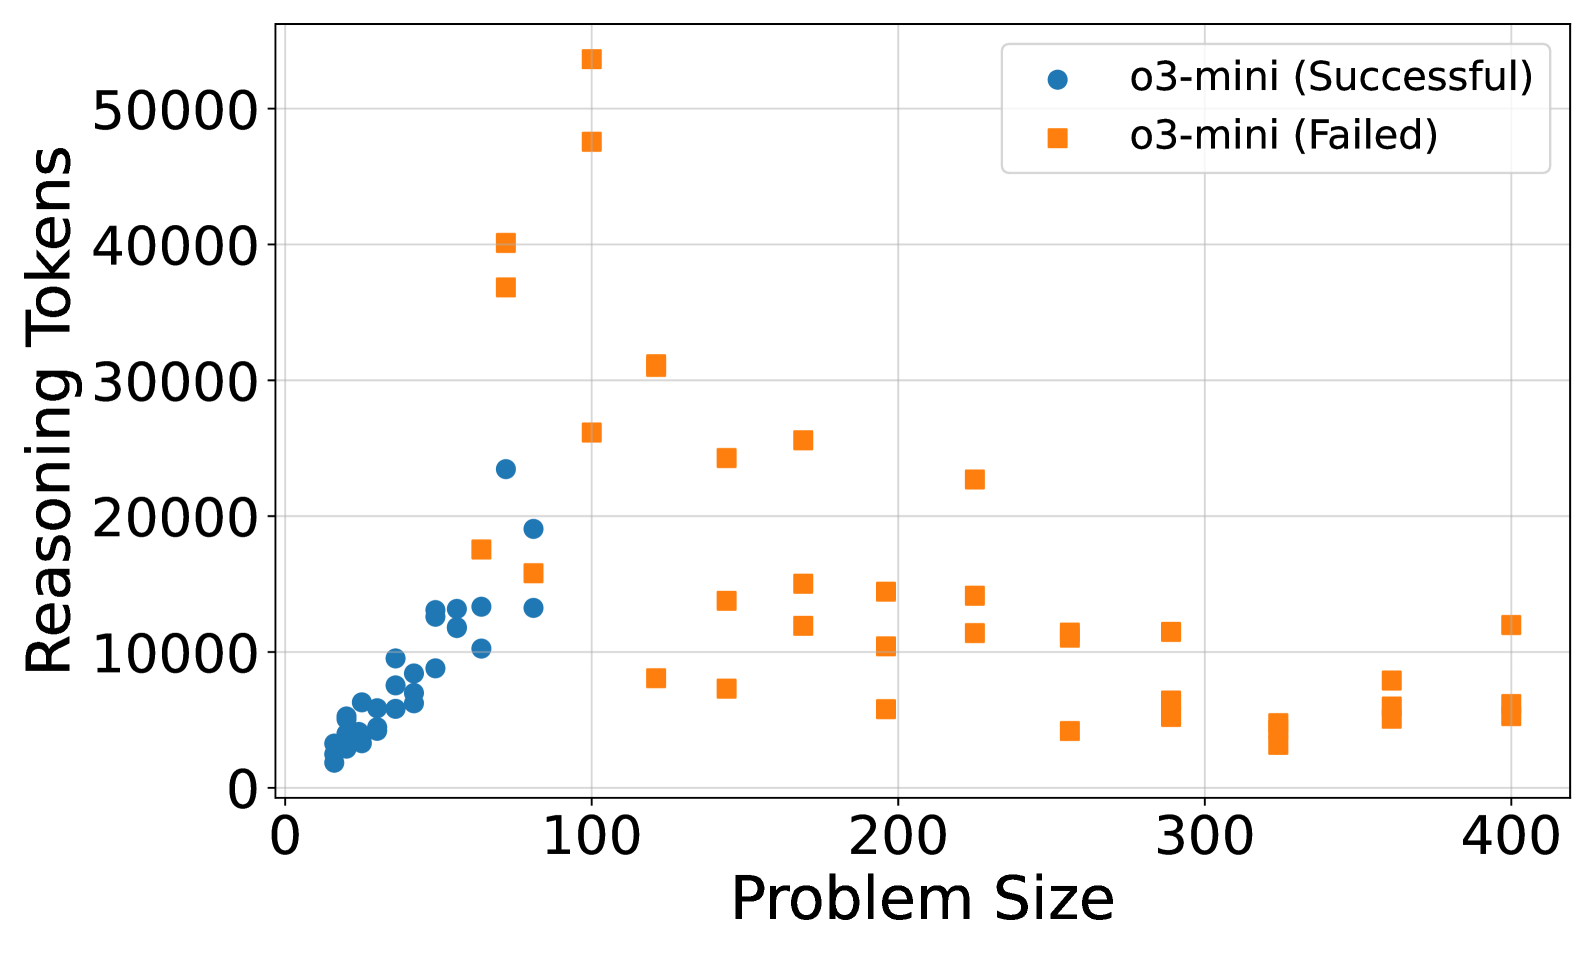
This image presents a scatter plot visualizing the relationship between "Problem Size" and "Reasoning Tokens" for two categories: successful and failed attempts, both labeled as "o3-mini". The plot aims to show how the number of reasoning tokens used changes with the size of the problem, and whether success or failure correlates with token usage.
### Components/Axes
* **X-axis:** "Problem Size" - ranging from approximately 0 to 420.
* **Y-axis:** "Reasoning Tokens" - ranging from 0 to 52000.
* **Legend:** Located in the top-right corner.
* Blue circles: "o3-mini (Successful)"
* Orange squares: "o3-mini (Failed)"
* **Grid:** A light gray grid is present, aiding in the reading of values.
### Detailed Analysis
The plot contains two distinct data series: successful and failed "o3-mini" attempts.
**Successful Attempts (Blue Circles):**
The trend for successful attempts is generally upward, but with significant variation.
* At a Problem Size of approximately 10, Reasoning Tokens are around 2000.
* As Problem Size increases to around 80, Reasoning Tokens increase to approximately 22000.
* Around a Problem Size of 100, Reasoning Tokens reach a peak of around 25000.
* From Problem Size 100 to 400, Reasoning Tokens fluctuate between 5000 and 15000, with a general decreasing trend.
**Failed Attempts (Orange Squares):**
The trend for failed attempts is more scattered and generally shows a decrease in Reasoning Tokens as Problem Size increases.
* At a Problem Size of approximately 10, Reasoning Tokens are around 1000.
* Between Problem Sizes of 50 and 150, Reasoning Tokens vary widely, ranging from approximately 8000 to 50000.
* From Problem Size 200 to 400, Reasoning Tokens generally decrease, fluctuating between 5000 and 10000.
* There is a notable outlier at a Problem Size of approximately 120, with Reasoning Tokens around 52000.
### Key Observations
* **Positive Correlation (Successful):** There's a positive correlation between Problem Size and Reasoning Tokens for successful attempts, up to a certain point (around Problem Size 100). Beyond that, the correlation weakens.
* **Negative Correlation (Failed):** There's a general negative correlation between Problem Size and Reasoning Tokens for failed attempts, though it's less consistent.
* **Outlier:** The failed attempt at a Problem Size of approximately 120 with 52000 Reasoning Tokens is a significant outlier.
* **Token Usage:** Successful attempts generally use fewer tokens than failed attempts for larger problem sizes.
### Interpretation
The data suggests that for smaller problem sizes, successful "o3-mini" attempts require more reasoning tokens. This could indicate that the algorithm needs to explore more possibilities to find a solution when the problem is relatively simple. However, as the problem size increases, the number of tokens needed for success decreases, potentially because the problem becomes more constrained or the algorithm converges more quickly.
The failed attempts show a more erratic pattern, with a high outlier suggesting a case where the algorithm spent a significant amount of resources without finding a solution. The general decrease in token usage for failed attempts with increasing problem size could indicate that the algorithm gives up more quickly on larger problems, or that the search space becomes less navigable.
The difference in token usage between successful and failed attempts, particularly for larger problem sizes, suggests that there's a threshold of reasoning effort beyond which the algorithm is unlikely to succeed. The data could be used to optimize the algorithm's resource allocation, potentially by setting a maximum token limit or by dynamically adjusting the search strategy based on problem size.