## Scatter Plot: Reasoning Tokens vs. Problem Size for o3-mini
### Overview
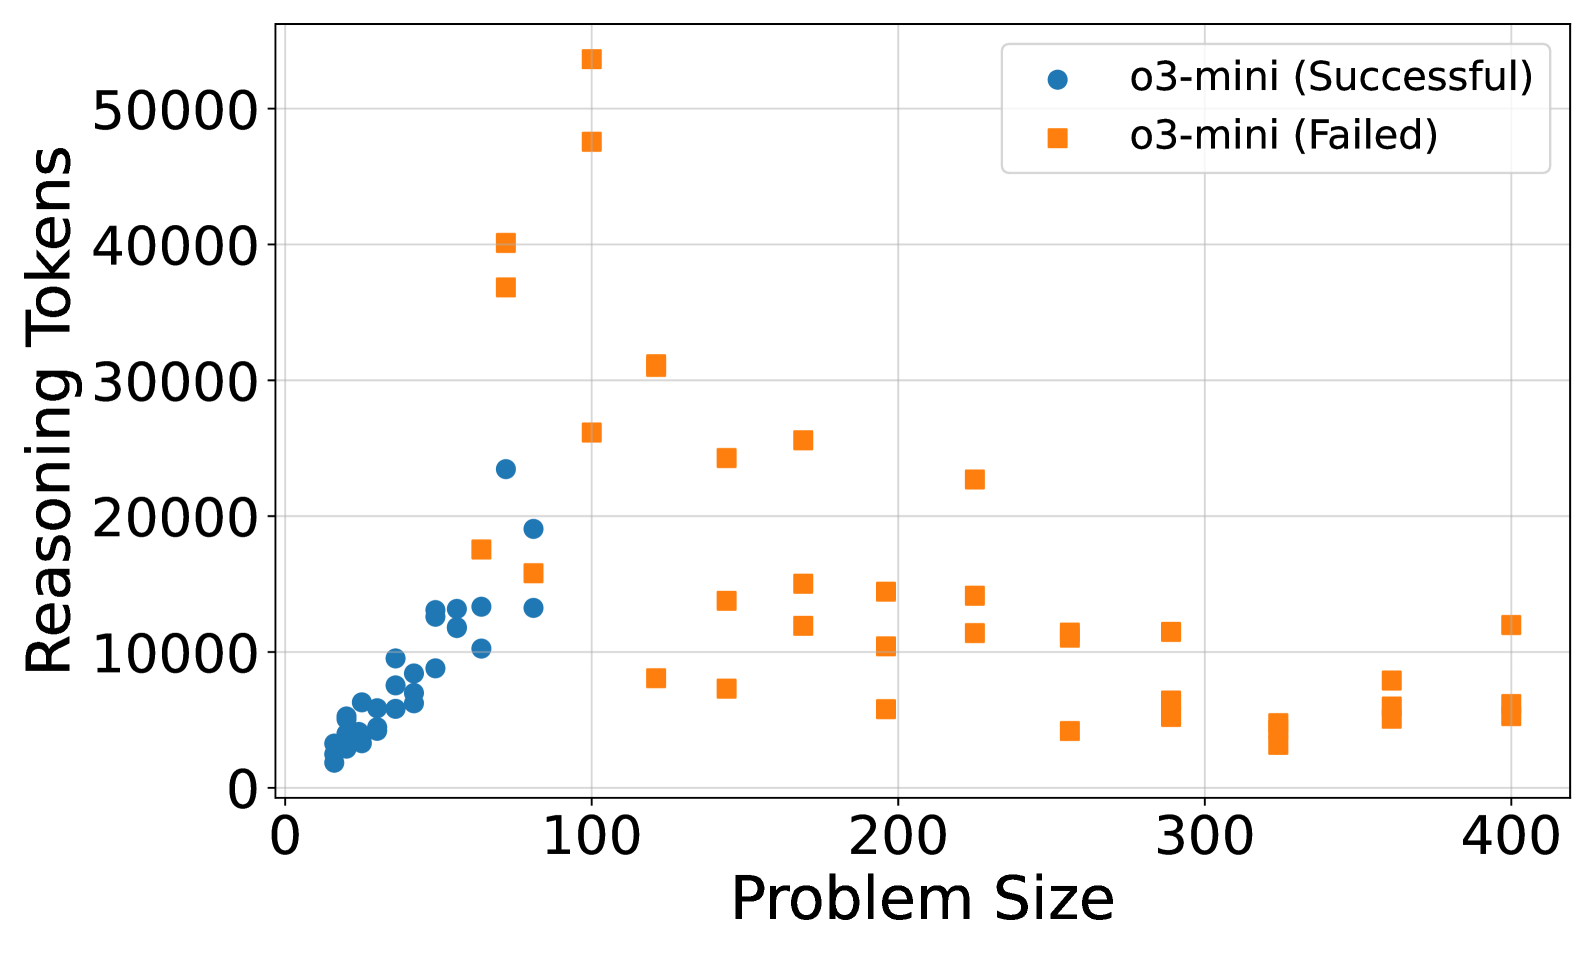
The image is a scatter plot comparing the number of reasoning tokens used by the o3-mini model against problem size, differentiated by success/failure outcomes. Two data series are represented: blue circles for successful runs and orange squares for failed runs. The plot spans problem sizes from 0 to 400 and reasoning tokens from 0 to 50,000.
### Components/Axes
- **X-axis (Problem Size)**: Labeled "Problem Size," ranging from 0 to 400 in increments of 100.
- **Y-axis (Reasoning Tokens)**: Labeled "Reasoning Tokens," ranging from 0 to 50,000 in increments of 10,000.
- **Legend**: Located in the top-right corner, with:
- **Blue circles**: "o3-mini (Successful)"
- **Orange squares**: "o3-mini (Failed)"
### Detailed Analysis
- **Blue Circles (Successful)**:
- Clustered primarily in the lower-left quadrant.
- Problem sizes range from ~0 to ~100.
- Reasoning tokens range from ~0 to ~25,000.
- Density decreases as problem size increases.
- **Orange Squares (Failed)**:
- Distributed across the entire plot but concentrated in the upper-right quadrant.
- Problem sizes range from ~50 to ~400.
- Reasoning tokens range from ~5,000 to ~50,000.
- Notable outliers: A few orange squares at problem size ~100 with reasoning tokens ~50,000.
### Key Observations
1. **Successful Runs**: Dominated by smaller problem sizes (<100) and lower token usage (<25,000).
2. **Failed Runs**: More variable, with larger problem sizes (>200) and higher token usage (>10,000).
3. **Outliers**: A small subset of failed runs at problem size ~100 required ~50,000 tokens, suggesting inefficiency or edge cases.
### Interpretation
The data suggests that successful reasoning by o3-mini is strongly correlated with smaller problem sizes and efficient token usage. Failed runs, however, exhibit a broader range of problem sizes and token consumption, indicating potential challenges with scalability or resource allocation. The outliers at problem size ~100 with high token usage may represent edge cases where the model struggles despite smaller inputs, possibly due to algorithmic complexity or data quality issues. This highlights a trade-off between problem size, computational resources, and success rates for the o3-mini model.