## Line Chart: Normalized Indices Over Time
### Overview
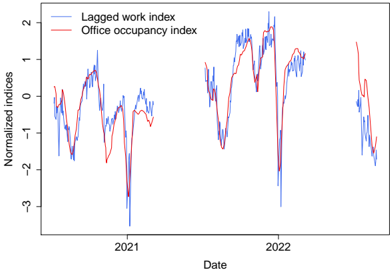
The image is a line chart comparing two normalized indices: "Lagged work index" (blue line) and "Office occupancy index" (red line) over the years 2021 and 2022. The chart visualizes the trends and relationships between these two indices over time.
### Components/Axes
* **X-axis:** Date, labeled with years 2021 and 2022.
* **Y-axis:** Normalized indices, ranging from -3 to 2, with tick marks at -2, -1, 0, 1, and 2.
* **Legend (top-left):**
* Blue line: Lagged work index
* Red line: Office occupancy index
### Detailed Analysis
* **Lagged work index (blue line):**
* In early 2021, the index starts around -1.5, rises to approximately 1, then drops sharply to around -3.
* It then recovers to around 1 by mid-2021, followed by a slight decline to around -0.5.
* In early 2022, the index starts around 1.5, fluctuates, and then experiences a sharp drop to around -2.5.
* It recovers to around 1 by mid-2022, followed by a decline to around -1.5 by the end of 2022.
* **Office occupancy index (red line):**
* In early 2021, the index starts around 0, rises to approximately 0.5, then drops to around -2.
* It then recovers to around 0 by mid-2021, followed by a slight decline to around -0.5.
* In early 2022, the index starts around 1, fluctuates, and then experiences a sharp drop to around -2.
* It recovers to around 1.5 by mid-2022, followed by a decline to around -1 by the end of 2022.
### Key Observations
* Both indices show similar trends, with the "Lagged work index" generally exhibiting more volatility (larger fluctuations) than the "Office occupancy index".
* Both indices experience significant drops in early 2021 and early 2022.
* The "Office occupancy index" appears to lag slightly behind the "Lagged work index" in some instances, as suggested by the "Lagged" prefix in the latter's name.
### Interpretation
The chart suggests a correlation between the "Lagged work index" and "Office occupancy index" over the period of 2021-2022. The similar trends indicate that changes in one index are reflected in the other, although the "Lagged work index" seems to be more sensitive to external factors, resulting in greater fluctuations. The drops in both indices in early 2021 and early 2022 could be attributed to specific events or seasonal variations affecting both work patterns and office occupancy. The lagging behavior of the "Office occupancy index" might indicate that changes in work patterns (captured by the "Lagged work index") precede changes in office occupancy.