## Line Graph: Normalized Work and Office Occupancy Indices (2021-2022)
### Overview
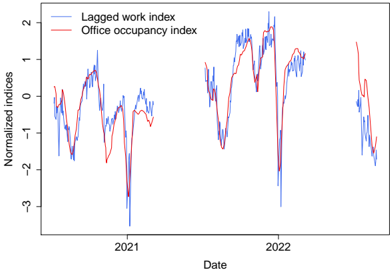
The image displays a line graph comparing two time-series datasets: the "Lagged work index" (blue line) and the "Office occupancy index" (red line). Both indices are normalized and plotted against a date axis spanning 2021 to 2022. The graph shows significant volatility in both metrics, with sharp peaks and troughs.
### Components/Axes
- **X-axis (Date)**: Labeled "Date," with approximate markers for 2021 and 2022. No specific month/day labels are visible.
- **Y-axis (Normalized indices)**: Labeled "Normalized indices," with tick marks at -3, -2, -1, 0, 1, and 2.
- **Legend**: Located in the **top-right corner**, with two entries:
- **Blue line**: "Lagged work index"
- **Red line**: "Office occupancy index"
### Detailed Analysis
1. **Lagged work index (Blue line)**:
- **2021**: Starts near 0, dips sharply to **-3** around mid-2021, then recovers to **1.5** by late 2021.
- **2022**: Begins at **1.5**, fluctuates between **0.5** and **2**, with a notable dip to **-1** in early 2022.
- **Trend**: Volatile with a pronounced recovery phase in late 2021.
2. **Office occupancy index (Red line)**:
- **2021**: Starts near 0, rises to **1.5** in mid-2021, then drops to **-2.5** by late 2021.
- **2022**: Begins at **-2.5**, recovers to **1.5** by mid-2022, with a sharp decline to **-1** in late 2022.
- **Trend**: Steeper fluctuations, with a delayed recovery compared to the Lagged work index.
### Key Observations
- Both indices exhibit **high volatility**, with normalized values ranging from **-3 to +2**.
- The **Lagged work index** shows a deeper trough in mid-2021 (-3) but recovers faster than the Office occupancy index.
- The **Office occupancy index** experiences a sharper decline in late 2021 (-2.5) and a delayed rebound in 2022.
- The two lines **diverge significantly** in 2022, suggesting differing recovery patterns or external influences.
### Interpretation
The data suggests that **work and office occupancy metrics are influenced by external factors** (e.g., pandemics, policy changes). The "Lagged work index" may reflect delayed responses to events, while the "Office occupancy index" shows more immediate but volatile reactions. The divergence in 2022 highlights **asymmetric recovery rates** between work and office environments, possibly indicating shifts in remote work adoption or economic conditions. Outliers (e.g., the -3 and -2.5 troughs) could represent crisis points requiring further investigation.