## Line Graph: Average Correct Flips Across Iterations
### Overview
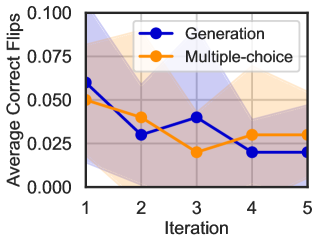
The image is a line graph comparing two data series ("Generation" and "Multiple-choice") across five iterations. The y-axis represents "Average Correct Flips" (0.000 to 0.100), and the x-axis represents "Iteration" (1 to 5). Shaded regions around each line indicate variability or confidence intervals.
### Components/Axes
- **X-axis (Iteration)**: Labeled "Iteration" with integer ticks (1–5).
- **Y-axis (Average Correct Flips)**: Labeled "Average Correct Flips" with increments of 0.025 (0.000–0.100).
- **Legend**: Located in the top-right corner, with:
- **Blue circles**: "Generation"
- **Orange circles**: "Multiple-choice"
- **Shaded Regions**: Gray for "Generation," light orange for "Multiple-choice," positioned symmetrically around each line.
### Detailed Analysis
#### Generation (Blue)
- **Data Points**:
- Iteration 1: ~0.060
- Iteration 2: ~0.030
- Iteration 3: ~0.040
- Iteration 4: ~0.020
- Iteration 5: ~0.020
- **Trend**: Starts at ~0.060, drops sharply to ~0.030 at iteration 2, fluctuates slightly upward at iteration 3, then declines to ~0.020 by iteration 4 and stabilizes.
#### Multiple-choice (Orange)
- **Data Points**:
- Iteration 1: ~0.050
- Iteration 2: ~0.040
- Iteration 3: ~0.020
- Iteration 4: ~0.030
- Iteration 5: ~0.030
- **Trend**: Starts at ~0.050, decreases to ~0.020 at iteration 3, then rises slightly to ~0.030 by iteration 4 and remains stable.
### Key Observations
1. **Initial Disparity**: "Generation" begins with a higher average (~0.060 vs. ~0.050) than "Multiple-choice" at iteration 1.
2. **Divergence at Iteration 2**: "Generation" drops below "Multiple-choice" (~0.030 vs. ~0.040).
3. **Stability in Later Iterations**: Both series converge to ~0.020–0.030 by iteration 4–5, with "Multiple-choice" showing slightly higher stability.
4. **Variability**: "Generation" has a larger shaded region (wider confidence interval) than "Multiple-choice," indicating greater uncertainty in its measurements.
### Interpretation
The data suggests that "Generation" initially outperforms "Multiple-choice" but experiences a significant decline in performance by iteration 2, with persistent variability. "Multiple-choice" maintains more consistent performance across iterations, though at a lower magnitude. The widening shaded region for "Generation" implies higher uncertainty in its results, potentially due to methodological instability or external factors affecting its outcomes. This could indicate that "Multiple-choice" is more reliable for sustained performance, while "Generation" may require refinement to address its early drop-off and variability.