\n
## Line Chart: Average Correct Flips vs. Iteration
### Overview
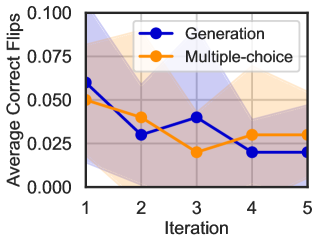
This image presents a line chart illustrating the relationship between the iteration number and the average correct flips for two different methods: "Generation" and "Multiple-choice". The chart also includes shaded regions representing the variance around each line.
### Components/Axes
* **X-axis:** Iteration, ranging from 1 to 5.
* **Y-axis:** Average Correct Flips, ranging from 0.000 to 0.100.
* **Data Series 1:** Generation (represented by a blue line with circular markers).
* **Data Series 2:** Multiple-choice (represented by an orange line with circular markers).
* **Legend:** Located in the top-right corner, identifying the two data series by color and name.
* **Shaded Regions:** Light purple around the "Generation" line and light orange around the "Multiple-choice" line, indicating variance or standard deviation.
### Detailed Analysis
**Generation (Blue Line):**
The blue line initially slopes downward from Iteration 1 to Iteration 2, then exhibits fluctuations.
* Iteration 1: Approximately 0.063
* Iteration 2: Approximately 0.035
* Iteration 3: Approximately 0.042
* Iteration 4: Approximately 0.026
* Iteration 5: Approximately 0.028
**Multiple-choice (Orange Line):**
The orange line also slopes downward from Iteration 1 to Iteration 2, then fluctuates more significantly.
* Iteration 1: Approximately 0.052
* Iteration 2: Approximately 0.032
* Iteration 3: Approximately 0.022
* Iteration 4: Approximately 0.024
* Iteration 5: Approximately 0.027
The shaded regions around each line indicate the variability of the data. The purple shaded region around the "Generation" line is generally wider than the orange shaded region around the "Multiple-choice" line, suggesting greater variance in the "Generation" method.
### Key Observations
* Both methods show a decreasing trend in average correct flips from Iteration 1 to Iteration 2.
* The "Generation" method starts with a slightly higher average correct flips than the "Multiple-choice" method at Iteration 1.
* The "Multiple-choice" method appears to have less variance than the "Generation" method.
* The lines fluctuate between Iterations 2 and 5, indicating that the performance of both methods is not consistently improving or declining.
### Interpretation
The chart suggests that both the "Generation" and "Multiple-choice" methods initially experience a decrease in performance (as measured by average correct flips) as the iteration number increases. The fluctuations observed after Iteration 2 indicate that the methods may be reaching a point of diminishing returns or encountering challenges in further improvement. The greater variance in the "Generation" method suggests that its performance is more sensitive to the specific conditions or data used in each iteration.
The data could be demonstrating the learning curve of two different algorithms or approaches. The initial drop might represent an initial period of adjustment or refinement, while the subsequent fluctuations could indicate the algorithms are converging towards a stable state or encountering limitations in their ability to improve. The difference in variance could be due to the inherent complexity or randomness of the "Generation" method compared to the "Multiple-choice" method.