## Line Chart: Average Correct Flips by Iteration
### Overview
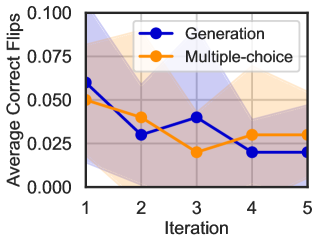
This is a line chart comparing the performance of two methods, "Generation" and "Multiple-choice," across five iterations. The performance metric is "Average Correct Flips." The chart includes shaded regions around each line, indicating variability or confidence intervals.
### Components/Axes
* **Chart Type:** Line chart with shaded confidence bands.
* **X-Axis (Horizontal):**
* **Label:** "Iteration"
* **Scale:** Discrete, linear scale from 1 to 5.
* **Markers:** 1, 2, 3, 4, 5.
* **Y-Axis (Vertical):**
* **Label:** "Average Correct Flips"
* **Scale:** Linear scale from 0.000 to 0.100.
* **Markers:** 0.000, 0.025, 0.050, 0.075, 0.100.
* **Legend:**
* **Position:** Top-right corner of the plot area.
* **Series 1:** "Generation" - Represented by a blue line with circular markers.
* **Series 2:** "Multiple-choice" - Represented by an orange line with circular markers.
* **Data Series & Shading:**
* Each line has a corresponding semi-transparent shaded area of the same color (light blue for Generation, light orange for Multiple-choice), representing the range of uncertainty or variance around the mean value.
### Detailed Analysis
**Trend Verification & Data Points (Approximate Values):**
* **Generation (Blue Line):**
* **Trend:** Starts highest, shows an overall downward trend with a small peak at iteration 3.
* **Data Points:**
* Iteration 1: ~0.060
* Iteration 2: ~0.030
* Iteration 3: ~0.040
* Iteration 4: ~0.020
* Iteration 5: ~0.020
* **Uncertainty Band (Approximate Range):** Widest at iteration 1 (spanning ~0.040 to ~0.080), narrows significantly by iteration 5.
* **Multiple-choice (Orange Line):**
* **Trend:** Starts lower than Generation, declines to a minimum at iteration 3, then shows a slight recovery.
* **Data Points:**
* Iteration 1: ~0.050
* Iteration 2: ~0.040
* Iteration 3: ~0.020
* Iteration 4: ~0.030
* Iteration 5: ~0.030
* **Uncertainty Band (Approximate Range):** Relatively consistent width across iterations, spanning roughly ±0.015 from the mean line.
**Spatial Relationships:**
* The two lines cross between iterations 1 and 2. Generation is higher at iteration 1, but Multiple-choice is higher at iteration 2.
* The lines cross again between iterations 3 and 4. Generation is higher at iteration 3, but Multiple-choice is higher at iterations 4 and 5.
* The shaded uncertainty bands overlap significantly between iterations 2 and 4, suggesting the performance difference between the two methods may not be statistically significant in that range.
### Key Observations
1. **Initial Advantage:** The "Generation" method starts with a higher average correct flips score (~0.060) compared to "Multiple-choice" (~0.050).
2. **Convergence and Crossover:** The performance of both methods converges and crosses over multiple times. "Multiple-choice" ends with a slightly higher score (~0.030) than "Generation" (~0.020) at iteration 5.
3. **Minimum Point:** Both methods reach their lowest performance at different iterations: "Generation" at iterations 4 & 5, and "Multiple-choice" at iteration 3.
4. **Variability:** The "Generation" method exhibits much higher variability (wider shaded band) in the early iterations, which decreases over time. The "Multiple-choice" method shows more consistent variability.
### Interpretation
The chart suggests a comparative study of two iterative processes or algorithms. The "Generation" method may be more powerful or effective initially but is less stable (higher variance) and its performance degrades more sharply over successive iterations. The "Multiple-choice" method starts slightly less effective but demonstrates more resilience, recovering after a dip and maintaining a more stable performance level in later iterations.
The overlapping confidence intervals are crucial; they indicate that for iterations 2 through 4, the observed differences in average correct flips between the two methods might be due to random chance rather than a true superiority of one method. The final data point (iteration 5) shows a clearer separation, with "Multiple-choice" outperforming "Generation," but the certainty of this conclusion depends on the width of the confidence bands at that point.
This pattern could imply a trade-off: "Generation" might be a high-risk, high-reward approach that excels early but is prone to degradation, while "Multiple-choice" is a more robust, consistent strategy that improves or stabilizes with more iterations. The "correct flips" metric itself suggests a task involving correction or improvement, where the two methods employ fundamentally different strategies.