\n
## Chart: Q²(v²) and Weighted Wavefunction Components
### Overview
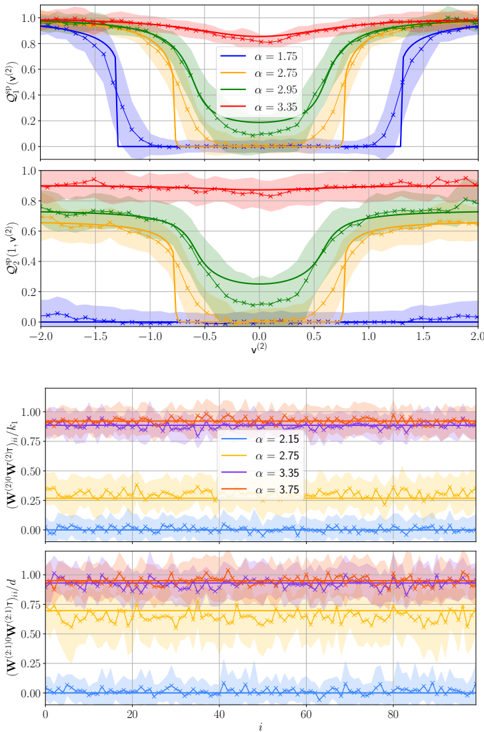
The image presents four charts arranged in a 2x2 grid. The top two charts display Q²(v²) as a function of v² for different values of α. The bottom two charts show the weighted wavefunction components (W₁W₂²/k₁ and W₁W₂²/h₁) as a function of index 'i', also for different α values. Each chart includes shaded regions representing uncertainty or standard deviation.
### Components/Axes
* **Top Charts:**
* **X-axis:** v² (ranging approximately from -2.0 to 2.0)
* **Y-axis:** Q²(v²) (ranging approximately from 0.2 to 1.0)
* **Legend:**
* α = 1.75 (Blue line)
* α = 2.75 (Purple line)
* α = 2.95 (Green line)
* α = 3.35 (Orange/Yellow line)
* **Bottom Charts:**
* **X-axis:** i (ranging approximately from 0 to 90)
* **Y-axis:**
* Top Bottom Chart: (W₁W₂²/k₁) (ranging approximately from 0.0 to 0.8)
* Bottom Bottom Chart: (W₁W₂²/h₁) (ranging approximately from 0.0 to 0.6)
* **Legend:**
* α = 2.15 (Blue line)
* α = 2.75 (Purple line)
* α = 3.35 (Orange/Yellow line)
* α = 3.75 (Red line)
### Detailed Analysis or Content Details
**Top Left Chart: Q²(v²) vs. v²**
* **α = 1.75 (Blue):** The line starts at approximately 0.85, decreases to a minimum of around 0.35 at v² ≈ 0, and then increases back to approximately 0.85.
* **α = 2.75 (Purple):** The line starts at approximately 0.8, decreases to a minimum of around 0.4 at v² ≈ 0, and then increases back to approximately 0.8.
* **α = 2.95 (Green):** The line starts at approximately 0.75, decreases to a minimum of around 0.3 at v² ≈ 0, and then increases back to approximately 0.75.
* **α = 3.35 (Orange/Yellow):** The line starts at approximately 0.9, decreases to a minimum of around 0.2 at v² ≈ 0, and then increases back to approximately 0.9.
**Top Right Chart: Q²(v²) vs. v²**
* **α = 1.75 (Blue):** The line starts at approximately 0.85, decreases to a minimum of around 0.35 at v² ≈ 0, and then increases back to approximately 0.85.
* **α = 2.75 (Purple):** The line starts at approximately 0.8, decreases to a minimum of around 0.4 at v² ≈ 0, and then increases back to approximately 0.8.
* **α = 2.95 (Green):** The line starts at approximately 0.75, decreases to a minimum of around 0.3 at v² ≈ 0, and then increases back to approximately 0.75.
* **α = 3.35 (Orange/Yellow):** The line starts at approximately 0.9, decreases to a minimum of around 0.2 at v² ≈ 0, and then increases back to approximately 0.9.
**Bottom Left Chart: (W₁W₂²/k₁) vs. i**
* **α = 2.15 (Blue):** The line fluctuates around 0.7, with variations between approximately 0.6 and 0.8.
* **α = 2.75 (Purple):** The line fluctuates around 0.5, with variations between approximately 0.4 and 0.6.
* **α = 3.35 (Orange/Yellow):** The line fluctuates around 0.25, with variations between approximately 0.15 and 0.35.
* **α = 3.75 (Red):** The line fluctuates around 0.1, with variations between approximately 0.05 and 0.15.
**Bottom Right Chart: (W₁W₂²/h₁) vs. i**
* **α = 2.15 (Blue):** The line fluctuates around 0.5, with variations between approximately 0.4 and 0.6.
* **α = 2.75 (Purple):** The line fluctuates around 0.3, with variations between approximately 0.2 and 0.4.
* **α = 3.35 (Orange/Yellow):** The line fluctuates around 0.15, with variations between approximately 0.05 and 0.25.
* **α = 3.75 (Red):** The line fluctuates around 0.05, with variations between approximately 0.0 and 0.1.
### Key Observations
* In the top charts, Q²(v²) exhibits a U-shaped curve for all α values, with a minimum at v² = 0. The depth of the U-shape (i.e., the minimum value of Q²(v²)) increases with increasing α.
* In the bottom charts, the weighted wavefunction components fluctuate around a mean value, with the amplitude of the fluctuations appearing relatively consistent across different values of 'i'.
* The weighted wavefunction components decrease with increasing α.
### Interpretation
The data suggests a relationship between the parameter α and the distribution of Q²(v²) and the weighted wavefunction components. The U-shaped curve of Q²(v²) indicates a concentration of probability around v² = 0, and this concentration becomes more pronounced as α increases. The decreasing trend in the weighted wavefunction components with increasing α suggests that the contribution of these components to the overall wavefunction diminishes as α grows.
The shaded regions around the lines indicate uncertainty or variability in the data. The consistent fluctuations in the bottom charts suggest a periodic or oscillatory behavior in the weighted wavefunction components, which may be related to the underlying physical system being modeled. The different α values likely represent different parameter settings or conditions within the system, leading to the observed variations in the data. The data could be used to understand the sensitivity of the system to changes in α and to optimize the parameter settings for desired outcomes.