TECHNICAL ASSET FINGERPRINT
e35ee55f367cc10f53d0b0ca
Click to view fullscreen
Press ESC or click to close
FOUND IN PAPERS
EXPERT: healer-alpha-free VERSION 1
RUNTIME: free/openrouter/healer-alpha
INTEL_VERIFIED
\n
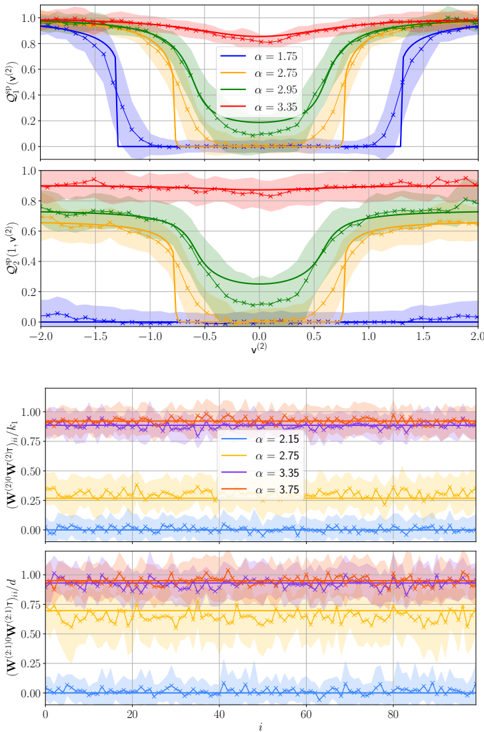
## Line Chart with Shaded Error Bands: Multi-Panel Analysis of Q and W Metrics vs. Parameters v and i
### Overview
The image is a composite of four distinct line charts arranged vertically in a 2x2 grid. Each chart displays data series for different values of a parameter `α` (alpha), represented by colored lines with shaded regions indicating uncertainty or variance. The top two panels plot a quantity `Q` against a variable `v^(2)`, while the bottom two panels plot a quantity `|W|` against an index `i`. The charts appear to be from a scientific or technical publication, likely in physics, engineering, or computational science.
### Components/Axes
**General Layout:**
- Four subplots stacked vertically.
- Each subplot has its own y-axis label and shares x-axis labels within pairs.
- Legends are embedded within each subplot.
**Top Panel (First Chart):**
- **Y-axis Label:** `Q^(2)(v^(2))`
- **X-axis Label:** `v^(2)` (shared with the second panel)
- **X-axis Range:** Approximately -2.0 to 2.0.
- **Y-axis Range:** 0.0 to 1.0.
- **Legend:** Located in the upper-right quadrant. Contains four entries:
- Blue line: `α = 1.75`
- Orange line: `α = 2.75`
- Green line: `α = 2.95`
- Red line: `α = 3.35`
**Second Panel (Second Chart):**
- **Y-axis Label:** `Q^(2)(1, v^(2))`
- **X-axis Label:** `v^(2)` (shared with the first panel)
- **X-axis Range:** Approximately -2.0 to 2.0.
- **Y-axis Range:** 0.0 to 1.0.
- **Legend:** Not explicitly shown, but the line colors and styles correspond to the same `α` values as the first panel's legend.
**Third Panel (Third Chart):**
- **Y-axis Label:** `|W^(2N)W^(2N)|_ij / k_j`
- **X-axis Label:** `i` (shared with the fourth panel)
- **X-axis Range:** 0 to approximately 100.
- **Y-axis Range:** 0.00 to 1.00.
- **Legend:** Located in the upper-right quadrant. Contains four entries:
- Blue line: `α = 2.15`
- Yellow line: `α = 2.75`
- Purple line: `α = 3.35`
- Orange line: `α = 3.75`
**Fourth Panel (Fourth Chart):**
- **Y-axis Label:** `|W^(2N)W^(2N)|_ij / d_j`
- **X-axis Label:** `i` (shared with the third panel)
- **X-axis Range:** 0 to approximately 100.
- **Y-axis Range:** 0.00 to 1.00.
- **Legend:** Not explicitly shown, but the line colors and styles correspond to the same `α` values as the third panel's legend.
### Detailed Analysis
**Top Panel (`Q^(2)(v^(2))` vs. `v^(2)`):**
- **Trend Verification:** All four lines are symmetric around `v^(2) = 0`. They start high near `v^(2) = ±2.0`, dip to a minimum at `v^(2) = 0`, and rise again.
- **Data Series:**
- **Blue (`α = 1.75`):** Forms a deep, flat-bottomed well. Value is ~1.0 at `v^(2) = ±2.0`, drops sharply to ~0.0 between `v^(2) ≈ -1.5` and `1.5`, and remains near 0.0 in that central region.
- **Orange (`α = 2.75`):** Forms a narrower well. Value is ~1.0 at `v^(2) = ±2.0`, drops to a minimum of ~0.0 at `v^(2) = 0`. The transition is steep.
- **Green (`α = 2.95`):** Forms a shallower, rounded well. Value is ~1.0 at `v^(2) = ±2.0`, dips to a minimum of ~0.1 at `v^(2) = 0`.
- **Red (`α = 3.35`):** Nearly flat line close to 1.0 across the entire range, with a very slight dip to ~0.9 at `v^(2) = 0`.
- **Shaded Regions:** Each line has a semi-transparent shaded band of the same color, indicating the spread or error. The blue band is widest in the well region.
**Second Panel (`Q^(2)(1, v^(2))` vs. `v^(2)`):**
- **Trend Verification:** Similar symmetric, well-shaped trends as the first panel, but with different depths and widths.
- **Data Series:**
- **Blue (`α = 1.75`):** Very low, nearly flat line close to 0.0 across the entire range.
- **Orange (`α = 2.75`):** Forms a well. Value is ~0.7 at `v^(2) = ±2.0`, drops to a minimum of ~0.0 at `v^(2) = 0`.
- **Green (`α = 2.95`):** Forms a shallower well. Value is ~0.75 at `v^(2) = ±2.0`, dips to a minimum of ~0.1 at `v^(2) = 0`.
- **Red (`α = 3.35`):** Nearly flat line around 0.9 across the entire range, with minor fluctuations.
**Third Panel (`|W...|_ij / k_j` vs. `i`):**
- **Trend Verification:** Lines are relatively flat with noise/fluctuations. No strong upward or downward trend across `i`.
- **Data Series:**
- **Blue (`α = 2.15`):** Fluctuates near 0.00.
- **Yellow (`α = 2.75`):** Fluctuates around 0.35.
- **Purple (`α = 3.35`):** Fluctuates around 0.90.
- **Orange (`α = 3.75`):** Fluctuates around 0.95, slightly above the purple line.
- **Shaded Regions:** All series have wide, overlapping shaded bands, indicating high variance or noise in the measurements.
**Fourth Panel (`|W...|_ij / d_j` vs. `i`):**
- **Trend Verification:** Similar flat, noisy trends as the third panel.
- **Data Series:**
- **Blue (`α = 2.15`):** Fluctuates near 0.00.
- **Yellow (`α = 2.75`):** Fluctuates around 0.65.
- **Purple (`α = 3.35`):** Fluctuates around 0.95.
- **Orange (`α = 3.75`):** Fluctuates around 0.98, very close to the purple line.
- **Shaded Regions:** Wide, overlapping shaded bands, similar to the third panel.
### Key Observations
1. **Parameter `α` Controls Behavior:** In the top two panels, increasing `α` systematically reduces the depth and width of the "well" in the `Q` metric. At the highest `α` shown (3.35), the well almost disappears.
2. **Symmetry:** The `Q` vs. `v^(2)` plots are perfectly symmetric around `v^(2)=0`, suggesting an even function or a system with symmetric properties.
3. **Metric Sensitivity:** The `Q^(2)(v^(2))` metric (top panel) is more sensitive to low `α` values (showing a deep well for `α=1.75`) than the `Q^(2)(1, v^(2))` metric (second panel), where the same `α` yields a near-zero flat line.
4. **Noise in W Metrics:** The bottom two panels show significantly more point-to-point fluctuation (noise) in the `|W|` metrics compared to the smoother `Q` metrics. The shaded error bands are correspondingly wider.
5. **Saturation at High `α`:** For the `|W|` metrics (bottom panels), the values for `α=3.35` and `α=3.75` are very close, suggesting a saturation effect where increasing `α` beyond ~3.35 yields diminishing changes.
### Interpretation
This figure likely illustrates the results of a numerical simulation or theoretical model where a system's response (measured by `Q` and `|W|`) is studied as a function of an external parameter `v` and an internal parameter `α`.
- **What the data suggests:** The parameter `α` appears to be a control parameter that tunes the system's state. Low `α` values correspond to a highly responsive or "ordered" state where the `Q` metric shows a strong, sharp dependence on `v^(2)`. As `α` increases, the system becomes less responsive to `v`, entering a more "disordered" or saturated state where `Q` is high and nearly constant. The `|W|` metrics, which might represent some form of correlation or weight matrix norm, show a clear stratification by `α` but are noisy, indicating they are ensemble averages over a disordered system.
- **Relationship between elements:** The top and bottom panels likely show complementary aspects of the same system. The smooth, deterministic-looking curves in the top panels could represent an order parameter or average quantity, while the noisy bottom panels could represent fluctuations or microscopic details. The consistent color-coding for `α` across panels allows direct comparison.
- **Notable anomalies:** The most striking feature is the qualitative change in the shape of the `Q` curves from a deep, flat-bottomed well (blue, `α=1.75`) to a shallow dip (green, `α=2.95`) to an almost flat line (red, `α=3.35`). This suggests a possible phase transition or critical point somewhere between `α=2.75` and `α=3.35`. The near-overlap of the `α=3.35` and `α=3.75` lines in the bottom panels supports the idea of an asymptotic or saturated regime at high `α`.
DECODING INTELLIGENCE...