## Charts: Scaling Laws for Neural Language Models
### Overview
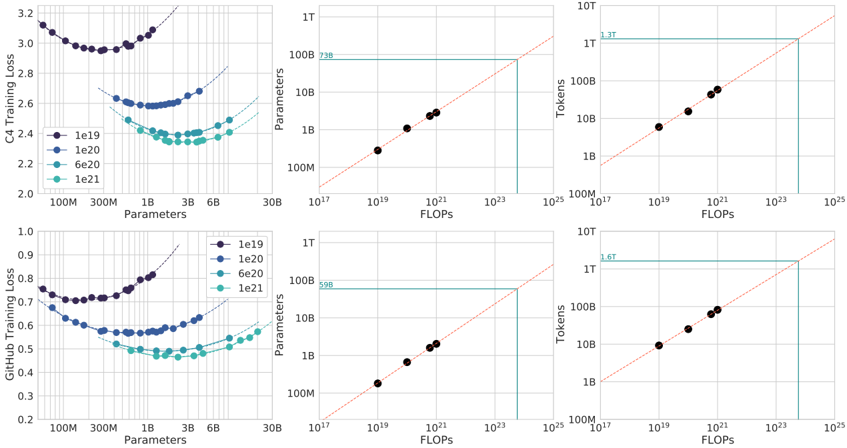
The image presents six charts arranged in a 2x3 grid, illustrating scaling laws for neural language models. The charts explore the relationship between model parameters, FLOPs (floating point operations), tokens processed, and training loss on two datasets: C4 and GitHub. Each chart type (loss vs. parameters, parameters vs. FLOPs, tokens vs. FLOPs) is presented for both datasets. Different model sizes (1e19, 1e20, 6e20, 1e21) are represented by different colored lines.
### Components/Axes
* **Chart 1 (Top-Left):** C4 Training Loss vs. Parameters
* X-axis: Parameters (100M to 6B, logarithmic scale)
* Y-axis: C4 Training Loss (2.0 to 3.2, linear scale)
* **Chart 2 (Top-Center):** Parameters vs. FLOPs
* X-axis: FLOPs (10^17 to 10^23, logarithmic scale)
* Y-axis: Parameters (100M to 1T, logarithmic scale)
* **Chart 3 (Top-Right):** Tokens vs. FLOPs
* X-axis: FLOPs (10^17 to 10^23, logarithmic scale)
* Y-axis: Tokens (1B to 1T, logarithmic scale)
* **Chart 4 (Bottom-Left):** GitHub Training Loss vs. Parameters
* X-axis: Parameters (100M to 6B, logarithmic scale)
* Y-axis: GitHub Training Loss (0.2 to 1.0, linear scale)
* **Chart 5 (Bottom-Center):** Parameters vs. FLOPs
* X-axis: FLOPs (10^17 to 10^23, logarithmic scale)
* Y-axis: Parameters (100M to 1T, logarithmic scale)
* **Chart 6 (Bottom-Right):** Tokens vs. FLOPs
* X-axis: FLOPs (10^17 to 10^23, logarithmic scale)
* Y-axis: Tokens (1B to 1T, logarithmic scale)
**Legend (shared across all charts):**
* Black: 1e19
* Blue: 1e20
* Light Blue: 6e20
* Green: 1e21
### Detailed Analysis or Content Details
**Chart 1: C4 Training Loss vs. Parameters**
* The black line (1e19) starts at approximately 3.0 loss at 100M parameters, decreases sharply to around 2.4 loss at 300M parameters, and then plateaus around 2.3-2.4 loss for larger parameter sizes.
* The blue line (1e20) starts at approximately 2.8 loss at 100M parameters, decreases more rapidly than the black line, reaching around 2.2 loss at 300M parameters, and then plateaus around 2.1-2.2 loss.
* The light blue line (6e20) shows a similar trend, starting at around 2.6 loss, decreasing to approximately 2.0 loss, and then plateauing.
* The green line (1e21) starts at approximately 2.4 loss, decreases to around 1.9 loss, and then plateaus.
**Chart 2: Parameters vs. FLOPs**
* All lines (black, blue, light blue, green) are approximately linear and follow the same trajectory. The lines show a direct proportional relationship between parameters and FLOPs.
* At 10^17 FLOPs, the parameter count is approximately 100M for all models.
* At 10^21 FLOPs, the parameter count is approximately 10B for all models.
* At 10^23 FLOPs, the parameter count is approximately 100B for all models.
* The slope of the lines is roughly consistent, indicating a constant FLOPs-to-parameter ratio.
**Chart 3: Tokens vs. FLOPs**
* Similar to the Parameters vs. FLOPs chart, all lines are approximately linear and follow the same trajectory.
* At 10^17 FLOPs, the token count is approximately 1B for all models.
* At 10^21 FLOPs, the token count is approximately 10B for all models.
* At 10^23 FLOPs, the token count is approximately 100B for all models.
**Chart 4: GitHub Training Loss vs. Parameters**
* The black line (1e19) starts at approximately 0.8 loss at 100M parameters, decreases to around 0.6 loss at 300M parameters, and then plateaus around 0.5-0.6 loss.
* The blue line (1e20) starts at approximately 0.75 loss, decreases more rapidly, reaching around 0.5 loss at 300M parameters, and then plateaus around 0.4-0.5 loss.
* The light blue line (6e20) shows a similar trend, starting at around 0.7 loss, decreasing to approximately 0.4 loss, and then plateauing.
* The green line (1e21) starts at approximately 0.65 loss, decreases to around 0.35 loss, and then plateaus.
**Chart 5: Parameters vs. FLOPs**
* Identical to Chart 2.
**Chart 6: Tokens vs. FLOPs**
* Identical to Chart 3.
### Key Observations
* **Loss Decreases with Parameters:** For both C4 and GitHub datasets, training loss generally decreases as the number of parameters increases, but the improvement diminishes beyond a certain point (plateau).
* **Linear Scaling of FLOPs:** The relationship between parameters and FLOPs, and between tokens and FLOPs, appears to be approximately linear. This suggests that increasing model size or dataset size requires a proportional increase in computational resources.
* **Dataset Dependence:** The absolute values of the training loss are different for the C4 and GitHub datasets, indicating that the difficulty of the training task varies between the two datasets. The GitHub dataset consistently shows lower loss values for a given parameter count.
* **Consistent Scaling Laws:** The scaling laws (relationships between parameters, FLOPs, and tokens) appear to be consistent across different model sizes.
### Interpretation
These charts demonstrate the scaling laws governing the performance of neural language models. They suggest that increasing model size (parameters) and dataset size (tokens) leads to improved performance (lower training loss), but with diminishing returns. The linear relationship between FLOPs and parameters/tokens highlights the computational cost associated with scaling up these models. The differences in loss between the C4 and GitHub datasets suggest that the choice of training data significantly impacts model performance. The consistent scaling laws across different model sizes indicate that these relationships are fundamental and can be used to predict the performance of even larger models. The plateauing of loss curves suggests that simply increasing model size indefinitely may not be the most effective strategy for improving performance; other factors, such as model architecture and training techniques, may become more important at larger scales. The charts provide empirical evidence supporting the idea that computational resources are a key limiting factor in the development of large language models.