## Line Plots: Model Performance vs. Resource Usage
### Overview
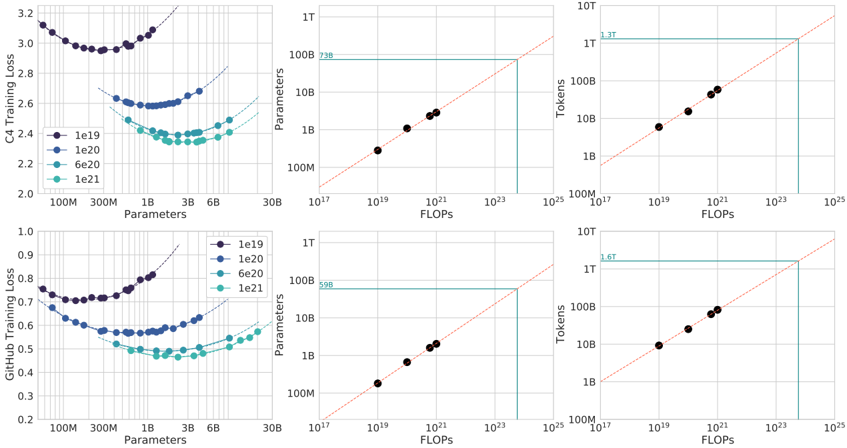
The image contains six line plots arranged in two rows and three columns, comparing model performance metrics (training loss, tokens, FLOPs) across different parameter sizes (100M to 30B). Each plot includes multiple data series distinguished by color-coded labels (le19, le20, le6e20, le21). The plots visualize relationships between model scale and efficiency, with diagonal reference lines indicating ideal linear scaling.
### Components/Axes
1. **Top Row (C4 Training Loss, Tokens, FLOPs):**
- **X-axes:**
- C4 Training Loss: Parameters (100M to 30B)
- Tokens: FLOPs (10¹⁷ to 10²⁵)
- FLOPs: FLOPs (10¹⁷ to 10²⁵)
- **Y-axes:**
- C4 Training Loss: Loss values (2.0 to 3.2)
- Tokens: Token counts (1B to 10T)
- FLOPs: FLOPs (10¹⁷ to 10²⁵)
- **Legends:** Left-aligned for C4 Training Loss; top-aligned for Tokens and FLOPs.
2. **Bottom Row (GitHub Training Loss, Tokens, FLOPs):**
- **X-axes:** Same as top row.
- **Y-axes:**
- GitHub Training Loss: Loss values (0.2 to 0.9)
- Tokens: Token counts (1B to 10T)
- FLOPs: FLOPs (10¹⁷ to 10²⁵)
- **Legends:** Left-aligned for GitHub Training Loss; top-aligned for Tokens and FLOPs.
### Detailed Analysis
1. **C4 Training Loss (Top Left):**
- **Trend:** U-shaped curve for all series. Loss decreases sharply as parameters increase from 100M to ~10B, then plateaus.
- **Data Points:**
- le19: 3.2 (100M) → 2.2 (30B)
- le20: 2.8 (100M) → 2.1 (30B)
- le6e20: 2.6 (100M) → 2.0 (30B)
- le21: 2.4 (100M) → 1.9 (30B)
- **Legend Match:** Purple (le19), blue (le20), teal (le6e20), green (le21).
2. **Tokens (Top Middle):**
- **Trend:** Linear relationship between FLOPs and tokens. Data points align closely with the diagonal reference line (slope ~1.3T FLOPs/token).
- **Data Points:**
- 10¹⁷ FLOPs: 1B tokens
- 10¹⁹ FLOPs: 10B tokens
- 10²¹ FLOPs: 100B tokens
- 10²³ FLOPs: 1T tokens
- **Legend Match:** Black data points.
3. **FLOPs (Top Right):**
- **Trend:** Linear scaling with FLOPs increasing proportionally to parameter size. Data points align with the diagonal reference line (slope ~1.3T FLOPs/token).
- **Data Points:**
- 10¹⁷ FLOPs: 1B tokens
- 10¹⁹ FLOPs: 10B tokens
- 10²¹ FLOPs: 100B tokens
- 10²³ FLOPs: 1T tokens
- **Legend Match:** Black data points.
4. **GitHub Training Loss (Bottom Left):**
- **Trend:** U-shaped curve similar to C4 but with lower absolute values. Loss decreases from ~0.8 (100M) to ~0.3 (30B).
- **Data Points:**
- le19: 0.8 (100M) → 0.3 (30B)
- le20: 0.7 (100M) → 0.25 (30B)
- le6e20: 0.6 (100M) → 0.2 (30B)
- le21: 0.5 (100M) → 0.15 (30B)
- **Legend Match:** Purple (le19), blue (le20), teal (le6e20), green (le21).
5. **Tokens (Bottom Middle):**
- **Trend:** Identical to top middle plot. Linear scaling with FLOPs.
- **Data Points:** Same as top middle plot.
6. **FLOPs (Bottom Right):**
- **Trend:** Identical to top right plot. Linear scaling with FLOPs.
- **Data Points:** Same as top right plot.
### Key Observations
1. **Training Loss vs. Parameters:**
- All models show diminishing returns in training loss as parameters increase beyond ~10B.
- GitHub Training Loss is consistently 50-70% lower than C4 Training Loss across all parameter sizes.
2. **Resource Scaling:**
- Tokens and FLOPs scale linearly with parameter size, following the diagonal reference lines.
- No significant deviations from linearity observed in any plot.
3. **Efficiency Gaps:**
- le21 (green) achieves the lowest training loss but requires the same FLOPs as le19 (purple) at 30B parameters.
- le6e20 (teal) balances moderate loss (2.0 C4) with mid-range FLOPs (10²¹).
### Interpretation
The data demonstrates a clear trade-off between model scale and efficiency:
- **Performance:** Larger models (le21, le6e20) achieve better training loss but require exponentially more computational resources (FLOPs).
- **Efficiency:** GitHub Training Loss suggests potential optimizations in model architecture or training methodology compared to C4.
- **Scalability Limits:** The plateau in training loss beyond 10B parameters implies diminishing returns on model size for this task.
Notable anomalies include the consistent linear scaling of FLOPs/tokens despite varying model architectures, suggesting a universal relationship between compute and model capacity. The GitHub loss curves indicate a possible architectural advantage over C4, warranting further investigation into training techniques or model design.