## Violin Plot: Accuracy Comparison of Different LLM Configurations
### Overview
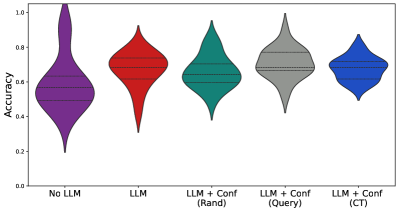
The image is a violin plot comparing the accuracy distributions of different configurations involving Large Language Models (LLMs). The plot displays the distribution of accuracy scores for each configuration, showing the median, interquartile range, and overall spread of the data. The x-axis represents the different LLM configurations, while the y-axis represents the accuracy.
### Components/Axes
* **Y-axis:** Accuracy, ranging from 0.0 to 1.0 in increments of 0.2.
* **X-axis:** LLM Configurations:
* No LLM
* LLM
* LLM + Conf (Rand)
* LLM + Conf (Query)
* LLM + Conf (CT)
### Detailed Analysis
Here's a breakdown of each configuration's accuracy distribution:
* **No LLM (Purple):**
* The distribution is highly skewed, with a long tail extending towards lower accuracy values.
* The median accuracy is approximately 0.55.
* The accuracy ranges from approximately 0.2 to 1.0.
* **LLM (Red):**
* The distribution is more symmetrical compared to "No LLM".
* The median accuracy is approximately 0.7.
* The accuracy ranges from approximately 0.3 to 0.9.
* **LLM + Conf (Rand) (Teal):**
* The distribution is relatively symmetrical.
* The median accuracy is approximately 0.65.
* The accuracy ranges from approximately 0.3 to 0.95.
* **LLM + Conf (Query) (Gray):**
* The distribution is relatively symmetrical.
* The median accuracy is approximately 0.7.
* The accuracy ranges from approximately 0.4 to 0.9.
* **LLM + Conf (CT) (Blue):**
* The distribution is relatively symmetrical.
* The median accuracy is approximately 0.65.
* The accuracy ranges from approximately 0.5 to 0.85.
### Key Observations
* The "No LLM" configuration has the widest distribution and the lowest median accuracy.
* The "LLM" and "LLM + Conf (Query)" configurations appear to have the highest median accuracy.
* The "LLM + Conf (CT)" configuration has the narrowest distribution, suggesting more consistent accuracy.
### Interpretation
The violin plot suggests that using an LLM generally improves accuracy compared to not using one at all. Adding a confidence mechanism ("Conf") to the LLM can further influence the accuracy distribution, depending on the method used (Rand, Query, CT). The "LLM + Conf (CT)" configuration seems to provide the most consistent accuracy, while "LLM" and "LLM + Conf (Query)" configurations achieve the highest median accuracy. The "No LLM" configuration shows the worst performance, with a wide range of accuracy values and a lower median.