## Violin Plot: Accuracy Distribution Across Five Methods
### Overview
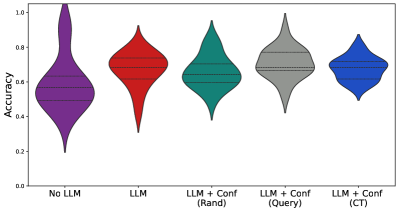
The image displays a violin plot comparing the distribution of accuracy scores for five different methods or conditions. Each "violin" represents the probability density of the data at different values, with a wider section indicating a higher frequency of data points at that accuracy level. The plot is set against a white background with black axes.
### Components/Axes
* **Y-Axis (Vertical):**
* **Label:** "Accuracy"
* **Scale:** Linear scale ranging from 0.0 to 1.0, with major tick marks at 0.0, 0.2, 0.4, 0.6, 0.8, and 1.0.
* **X-Axis (Horizontal):**
* **Categories (from left to right):**
1. `No LLM` (Purple violin)
2. `LLM` (Red violin)
3. `LLM + Conf (Rand)` (Teal/Green violin)
4. `LLM + Conf (Query)` (Grey violin)
5. `LLM + Conf (CT)` (Blue violin)
* **Legend:** There is no separate legend box. The category labels are placed directly below each corresponding violin on the x-axis.
### Detailed Analysis
Each violin plot shows the distribution shape, with horizontal lines inside likely representing quartiles (the middle line being the median).
1. **No LLM (Purple, far left):**
* **Shape:** Symmetrical, widest around the median, tapering sharply towards both ends. It has the longest vertical span, indicating the highest variance.
* **Estimated Median:** ~0.65
* **Estimated Interquartile Range (IQR):** Roughly from 0.55 to 0.75.
* **Range:** Extends from approximately 0.1 to 1.0.
2. **LLM (Red, second from left):**
* **Shape:** Slightly asymmetrical, with a bulge above the median. Narrower overall than the "No LLM" plot.
* **Estimated Median:** ~0.70
* **Estimated IQR:** Roughly from 0.60 to 0.80.
* **Range:** Extends from approximately 0.3 to 0.95.
3. **LLM + Conf (Rand) (Teal/Green, center):**
* **Shape:** Relatively symmetrical and compact. The distribution is concentrated around the median.
* **Estimated Median:** ~0.75
* **Estimated IQR:** Roughly from 0.65 to 0.85.
* **Range:** Extends from approximately 0.4 to 0.95.
4. **LLM + Conf (Query) (Grey, second from right):**
* **Shape:** Symmetrical and the most compact (narrowest vertical spread) of all plots. The distribution is highly concentrated.
* **Estimated Median:** ~0.80 (The highest median of the five groups).
* **Estimated IQR:** Roughly from 0.70 to 0.90.
* **Range:** Extends from approximately 0.5 to 0.95.
5. **LLM + Conf (CT) (Blue, far right):**
* **Shape:** Symmetrical, with a shape similar to the "LLM + Conf (Rand)" plot but positioned slightly higher.
* **Estimated Median:** ~0.78
* **Estimated IQR:** Roughly from 0.68 to 0.88.
* **Range:** Extends from approximately 0.45 to 0.95.
### Key Observations
* **Trend in Central Tendency:** The median accuracy increases progressively from left to right: `No LLM` < `LLM` < `LLM + Conf (Rand)` < `LLM + Conf (CT)` < `LLM + Conf (Query)`.
* **Trend in Variance (Spread):** The spread (variance) of accuracy scores generally decreases from left to right. The `No LLM` condition shows the widest spread (most inconsistent results), while `LLM + Conf (Query)` shows the narrowest spread (most consistent results).
* **Overlap:** There is significant overlap between the distributions of all five methods, indicating that while trends exist, individual results from one method can fall within the range of another.
* **Outliers:** The violin plot format does not explicitly show individual outlier points. The tapered ends suggest the presence of some extreme values, particularly in the `No LLM` condition.
### Interpretation
This chart demonstrates the impact of using a Large Language Model (LLM) and various confidence-based mechanisms ("Conf") on the accuracy of a task.
1. **Baseline vs. LLM:** Simply adding an LLM (`LLM` vs. `No LLM`) improves the median accuracy and reduces the variability of results, suggesting the LLM provides a more reliable and better-performing baseline.
2. **Effect of Confidence Mechanisms:** All three methods incorporating a confidence mechanism (`Rand`, `Query`, `CT`) outperform the plain `LLM` in terms of median accuracy. This suggests that adding a layer of confidence estimation or selection refines the LLM's outputs.
3. **Best Performing Method:** `LLM + Conf (Query)` achieves the highest median accuracy and the most consistent performance (smallest spread). This implies that a confidence mechanism based on "Query" is the most effective among those tested for both boosting average performance and ensuring reliability.
4. **Trade-off Insight:** The progression from `No LLM` to `LLM + Conf (Query)` shows a clear pattern: as methods become more sophisticated (adding LLM, then adding confidence mechanisms), they tend to yield both higher average accuracy and more predictable, consistent outcomes. The reduction in variance is as important as the increase in median score for practical applications where reliability is critical.
**In summary, the data suggests that integrating an LLM with a query-based confidence mechanism provides the optimal balance of high accuracy and low performance variance for the evaluated task.**