## Violin Plot: Accuracy Comparison Across Model Configurations
### Overview
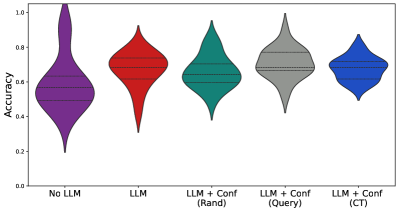
The image displays a violin plot comparing the accuracy distributions of five different model configurations. Each violin plot represents the spread and central tendency of accuracy values for a specific setup, with horizontal lines indicating median or mean values. The x-axis categorizes configurations, while the y-axis measures accuracy (0.0–1.0).
### Components/Axes
- **X-axis (Categories)**:
- "No LLM" (purple)
- "LLM" (red)
- "LLM + Conf (Rand)" (green)
- "LLM + Conf (Query)" (gray)
- "LLM + Conf (CT)" (blue)
- **Y-axis (Accuracy)**: Ranges from 0.0 to 1.0, labeled "Accuracy."
- **Legend**: Embedded in x-axis labels, with colors directly mapping to categories.
### Detailed Analysis
1. **No LLM (Purple)**:
- Median accuracy ~0.5 (horizontal line).
- Wide distribution (violin width), indicating high variability.
- Lower quartile ~0.3, upper quartile ~0.7.
2. **LLM (Red)**:
- Median accuracy ~0.7.
- Narrower distribution than "No LLM," suggesting reduced variability.
- Lower quartile ~0.6, upper quartile ~0.8.
3. **LLM + Conf (Rand) (Green)**:
- Median accuracy ~0.65.
- Slightly wider than "LLM," with lower quartile ~0.55 and upper quartile ~0.75.
4. **LLM + Conf (Query) (Gray)**:
- Median accuracy ~0.75.
- Narrower than "LLM + Conf (Rand)," with lower quartile ~0.7 and upper quartile ~0.85.
5. **LLM + Conf (CT) (Blue)**:
- Median accuracy ~0.8.
- Narrowest distribution, indicating the least variability.
- Lower quartile ~0.75, upper quartile ~0.85.
### Key Observations
- **Trend**: Accuracy improves as configurations evolve from "No LLM" to "LLM + Conf (CT)."
- **Outliers**: "No LLM" shows the widest spread, with some values dipping below 0.4.
- **Notable Pattern**: The "CT" configuration achieves the highest median accuracy (~0.8) and the smallest spread, suggesting it is the most stable and effective setup.
### Interpretation
The data demonstrates that incorporating a language model (LLM) and confidence mechanisms significantly enhances accuracy. The "CT" configuration (likely a specific confidence thresholding method) outperforms others, achieving the highest median accuracy and lowest variability. The "No LLM" group’s lower accuracy and wider distribution highlight the importance of model integration for consistent performance. The incremental improvements across configurations suggest that each added component (e.g., confidence strategies) contributes to better outcomes, with "CT" being the most effective.