### Technical Data Extraction: Solve Rate Comparison Chart
This document provides a detailed extraction of the data presented in the bar chart comparing "Solve rate" across different software engineering agents, categorized by the presence or absence of reproducible examples.
#### 1. Chart Metadata and Axes
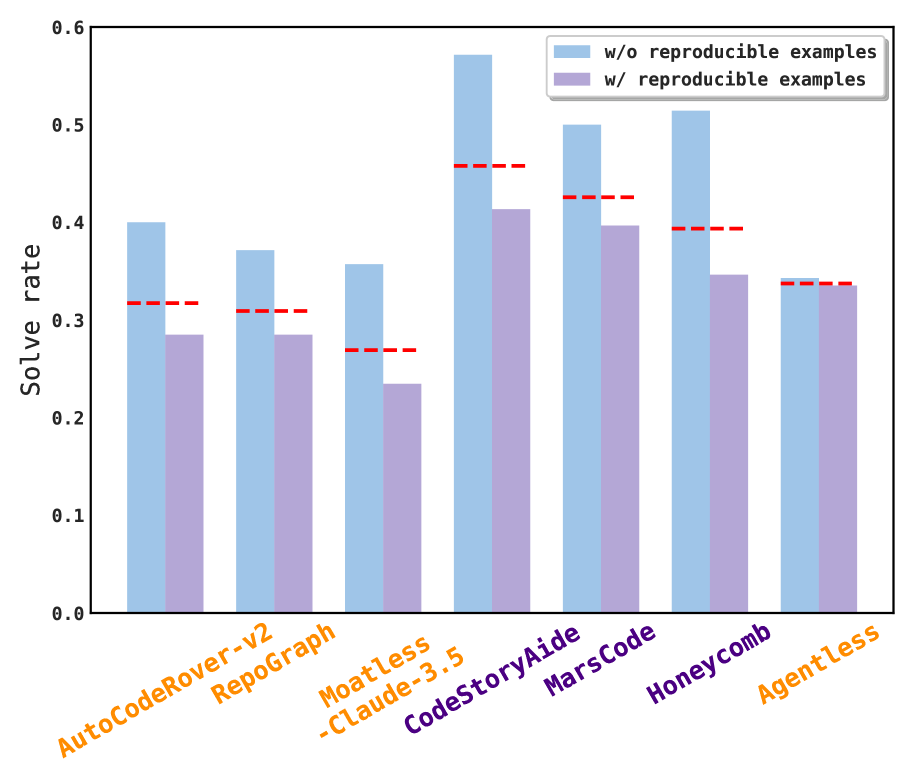
* **Y-Axis Title:** Solve rate
* **Y-Axis Scale:** 0.0 to 0.6 (increments of 0.1)
* **X-Axis Categories:** 7 distinct software agents/models.
* **Legend (Top Right):**
* **Light Blue Bar:** `w/o reproducible examples` (without)
* **Light Purple Bar:** `w/ reproducible examples` (with)
* **Red Dashed Line:** Represents the average or baseline solve rate for each specific category.
#### 2. Data Table Extraction
The following table reconstructs the visual data points. Values are estimated based on the Y-axis scale.
| Agent Name | Solve Rate (w/o reproducible) | Solve Rate (w/ reproducible) | Average (Red Dashed Line) |
| :--- | :---: | :---: | :---: |
| **AutoCodeRover-v2** | ~0.40 | ~0.28 | ~0.32 |
| **RepoGraph** | ~0.37 | ~0.28 | ~0.31 |
| **Moatless-Claude-3.5** | ~0.36 | ~0.23 | ~0.27 |
| **CodeStoryAide** | ~0.57 | ~0.41 | ~0.46 |
| **MarsCode** | ~0.50 | ~0.40 | ~0.43 |
| **Honeycomb** | ~0.51 | ~0.35 | ~0.39 |
| **Agentless** | ~0.34 | ~0.33 | ~0.34 |
#### 3. Trend Analysis and Observations
* **Consistent Performance Drop:** In every single category, the "w/o reproducible examples" (light blue) performance is higher than the "w/ reproducible examples" (light purple) performance. This indicates that these agents currently perform better when not provided with specific reproduction scripts/examples, or that the examples provided may introduce complexity that lowers the solve rate.
* **Top Performer:** **CodeStoryAide** shows the highest overall solve rate, peaking at approximately 0.57 without reproducible examples.
* **Lowest Performance Gap:** **Agentless** shows the smallest discrepancy between the two conditions, with both bars and the red dashed line converging around the 0.33–0.34 mark.
* **Largest Performance Gap:** **Honeycomb** and **Moatless-Claude-3.5** show significant drops in performance when reproducible examples are included.
* **X-Axis Label Coloring:**
* **Orange Labels:** AutoCodeRover-v2, RepoGraph, Moatless-Claude-3.5, Agentless.
* **Purple Labels:** CodeStoryAide, MarsCode, Honeycomb.
#### 4. Spatial Grounding and Component Isolation
* **Header/Legend:** Located at the top right [x=0.6, y=0.9]. It defines the two-bar comparison.
* **Main Chart Area:** Occupies the central 80% of the image. The red dashed lines are centered horizontally across each pair of bars for a specific agent.
* **Footer (X-Axis):** Labels are rotated approximately 30 degrees clockwise to accommodate long names. The color coding of the text (Orange vs. Purple) suggests a secondary grouping of the agents not explicitly defined in the main legend.