# Technical Document Extraction: Solve Rate Analysis of Code Generation Tools
## Chart Type
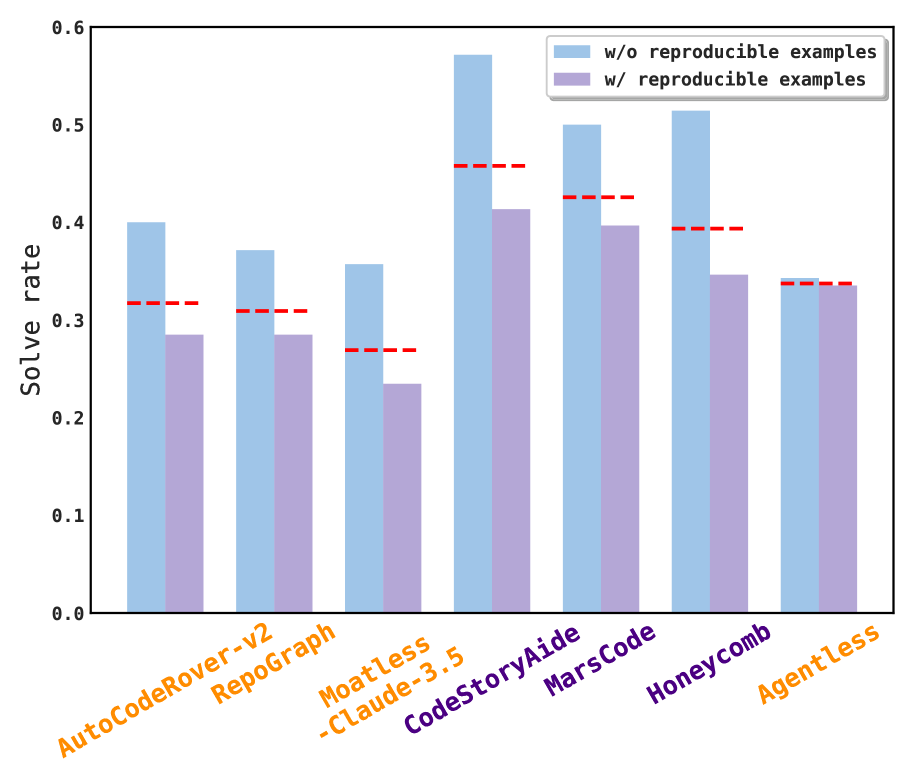
Bar chart comparing solve rates of code generation tools with and without reproducible examples.
## Axes
- **X-axis**: Code generation tools (categories)
- AutoCodeRover-v2
- RepoGraph
- Moatless-Claude-3.5
- CodeStoryAide
- MarsCode
- Honeycomb
- Agentless
- **Y-axis**: Solve rate (0.0 to 0.6 in increments of 0.1)
## Legend
- **Blue bars**: "w/o reproducible examples"
- **Purple bars**: "w/ reproducible examples"
- **Red dashed lines**: Reference thresholds at 0.3, 0.4, and 0.5
## Data Points
| Tool | w/o Examples (Blue) | w/ Examples (Purple) |
|-----------------------|---------------------|----------------------|
| AutoCodeRover-v2 | ~0.40 | ~0.29 |
| RepoGraph | ~0.37 | ~0.29 |
| Moatless-Claude-3.5 | ~0.35 | ~0.23 |
| CodeStoryAide | ~0.57 | ~0.41 |
| MarsCode | ~0.50 | ~0.40 |
| Honeycomb | ~0.52 | ~0.35 |
| Agentless | ~0.34 | ~0.34 |
## Key Observations
1. **General Trend**:
- Tools with reproducible examples (purple) consistently show higher solve rates than their counterparts without (blue), except for Agentless where both conditions are equal (~0.34).
2. **Highest Performers**:
- **CodeStoryAide**: Highest solve rate overall (~0.57 without examples, ~0.41 with examples).
- **MarsCode**: Strong performance (~0.50 without, ~0.40 with examples).
3. **Lowest Performers**:
- **Moatless-Claude-3.5**: Lowest solve rate with examples (~0.23), though still outperforms its "without examples" variant (~0.35).
4. **Threshold Analysis**:
- **0.3 threshold**: All tools except Moatless-Claude-3.5 (w/ examples) meet or exceed this.
- **0.4 threshold**: Only CodeStoryAide, MarsCode, and Honeycomb (w/ examples) reach this.
- **0.5 threshold**: Only CodeStoryAide (w/o examples) and Honeycomb (w/o examples) exceed this.
## Critical Notes
- **Agentless**: No improvement observed with reproducible examples (bars identical at ~0.34).
- **CodeStoryAide**: Demonstrates the largest absolute improvement (+0.16) when using reproducible examples.
- **Honeycomb**: Maintains high solve rates even without examples (~0.52), though drops to ~0.35 with examples.
## Structural Consistency
- All legend labels (blue/purple) align with bar colors.
- Red dashed lines correspond to y-axis thresholds (0.3, 0.4, 0.5).
- No missing or misaligned data points.