## BarChart: Tree LSTM Model Performance Across Configurations
### Overview
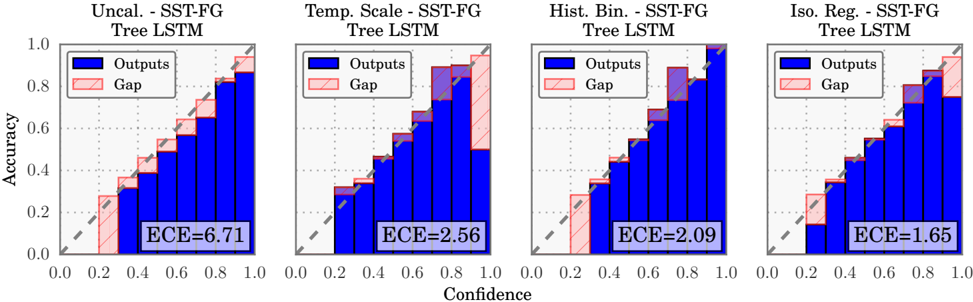
The image displays four side-by-side bar charts comparing the performance of a Tree LSTM model under different configurations. Each chart evaluates the relationship between **confidence** (x-axis) and **accuracy** (y-axis), with two data series: **Outputs** (blue bars) and **Gap** (pink bars). The charts are labeled with configuration names and include Expected Calibration Error (ECE) values.
---
### Components/Axes
- **X-axis**: "Confidence" (ranges from 0.0 to 1.0 in 0.2 increments).
- **Y-axis**: "Accuracy" (ranges from 0.0 to 1.0 in 0.2 increments).
- **Legend**:
- Blue bars: "Outputs" (model's predicted accuracy).
- Pink bars: "Gap" (difference between confidence and accuracy).
- **ECE Values**: Annotated in the bottom-left corner of each chart (e.g., ECE=6.71, ECE=2.56, etc.).
---
### Detailed Analysis
1. **Uncal. - SST-FG Tree LSTM** (ECE=6.71):
- **Outputs**: Accuracy increases with confidence, peaking at ~0.85 for confidence >0.8.
- **Gap**: Consistently smaller than Outputs, with a maximum gap of ~0.15 at confidence=1.0.
- **Trend**: Outputs show a stepwise increase, while the gap narrows as confidence grows.
2. **Temp. Scale - SST-FG Tree LSTM** (ECE=2.56):
- **Outputs**: Smoother upward trend compared to Uncal., reaching ~0.9 at confidence=1.0.
- **Gap**: Smaller than Uncal., with a maximum gap of ~0.1 at confidence=1.0.
- **Trend**: Outputs and gap both improve, indicating better calibration.
3. **Hist. Bin. - SST-FG Tree LSTM** (ECE=2.09):
- **Outputs**: Similar trend to Temp. Scale but with slightly lower accuracy (~0.85 at confidence=1.0).
- **Gap**: Narrower than Temp. Scale, with a maximum gap of ~0.08.
- **Trend**: Improved calibration over previous configurations.
4. **Iso. Reg. - SST-FG Tree LSTM** (ECE=1.65):
- **Outputs**: Highest accuracy (~0.95 at confidence=1.0).
- **Gap**: Smallest gap (~0.05 at confidence=1.0).
- **Trend**: Outputs and gap both show minimal deviation, indicating optimal calibration.
---
### Key Observations
- **ECE Decrease**: ECE values decrease from left to right (6.71 → 1.65), suggesting improved calibration with more sophisticated configurations.
- **Gap Reduction**: The "Gap" bars shrink significantly in later configurations, indicating reduced discrepancy between confidence and accuracy.
- **Outputs Trend**: All configurations show increasing accuracy with confidence, but Iso. Reg. achieves the highest performance.
---
### Interpretation
The data demonstrates that the Tree LSTM model's performance improves with advanced configurations (e.g., Iso. Reg.). Lower ECE values correlate with better calibration, meaning the model's confidence aligns more closely with actual accuracy. The "Gap" metric highlights that earlier configurations overestimate confidence, while later ones achieve near-optimal calibration. This suggests that techniques like temperature scaling, histogram binning, and isolation regularization enhance the model's reliability, making it more trustworthy for high-stakes applications.