## Heatmap: Layer vs Steps
### Overview
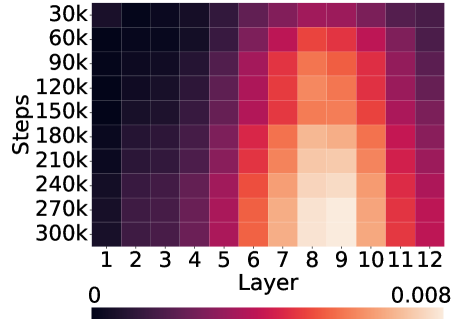
The image is a heatmap showing the relationship between "Steps" (training iterations) and "Layer" number, with the color intensity representing a value ranging from 0 to 0.008. The x-axis represents the layer number, ranging from 1 to 12. The y-axis represents the number of steps, ranging from 30k to 300k in increments of 30k. The color gradient ranges from dark purple (representing 0) to light orange (representing 0.008).
### Components/Axes
* **X-axis:** "Layer", with values from 1 to 12.
* **Y-axis:** "Steps", with values 30k, 60k, 90k, 120k, 150k, 180k, 210k, 240k, 270k, 300k.
* **Color Legend:** Ranges from 0 (dark purple) to 0.008 (light orange).
### Detailed Analysis
The heatmap shows a distinct pattern. The intensity (value) is low for early layers (1-4) and late layers (10-12) across all steps. The intensity increases towards the middle layers (5-9), peaking around layer 8. The highest intensity (light orange) is observed around layers 7-9 for steps between 150k and 240k.
* **Steps 30k-60k:** The values are generally low (dark purple) across all layers, with a slight increase in intensity around layers 6-8.
* **Steps 90k-120k:** The intensity increases, with a noticeable peak around layers 7-9.
* **Steps 150k-240k:** The intensity is highest, with the peak around layers 7-9 showing the lightest orange color.
* **Steps 270k-300k:** The intensity decreases slightly compared to the 150k-240k range, but remains higher than the initial steps.
### Key Observations
* The highest values are concentrated in the middle layers (7-9) and around the middle steps (150k-240k).
* The values are generally low for the first few layers (1-4) and the last few layers (10-12).
* The intensity increases as the number of steps increases, up to a point (around 150k-240k), after which it slightly decreases or plateaus.
### Interpretation
The heatmap suggests that the middle layers (7-9) are most active or sensitive during the training process, particularly around the 150k-240k step range. This could indicate that these layers are crucial for learning specific features or patterns in the data. The lower values in the initial and final layers might indicate that these layers are less involved in the core learning process, possibly handling input/output or more general feature extraction. The trend of increasing intensity with steps suggests that the model learns more effectively as training progresses, up to a certain point. The slight decrease or plateau after 240k steps might indicate diminishing returns or the need for adjustments to the training process.