## Heatmap: Layer Activation vs. Training Steps
### Overview
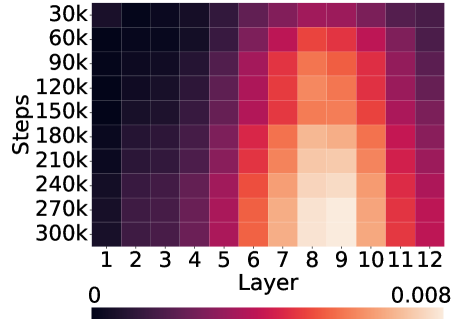
The image presents a heatmap visualizing the relationship between training steps and layer activation. The heatmap displays activation levels (represented by color intensity) across different layers of a model as training progresses through various steps. The color scale ranges from 0 (dark purple) to 0.008 (light yellow/orange).
### Components/Axes
* **X-axis:** "Layer" - Discrete values from 1 to 12.
* **Y-axis:** "Steps" - Discrete values in increments of 30k, ranging from 30k to 300k. Specifically: 30k, 60k, 90k, 120k, 150k, 180k, 210k, 240k, 270k, 300k.
* **Color Scale:** A gradient from dark purple (0) to light yellow/orange (0.008). This represents the activation level.
* **Legend:** Located at the bottom of the image, showing the color mapping to activation values.
### Detailed Analysis
The heatmap shows a clear pattern of increasing activation as training steps increase and as the layer number increases.
Here's a breakdown of approximate activation values based on color and the legend:
* **Layer 1:** Activation remains consistently low (approximately 0-0.001) across all steps.
* **Layer 2:** Activation remains consistently low (approximately 0-0.001) across all steps.
* **Layer 3:** Activation remains consistently low (approximately 0-0.001) across all steps.
* **Layer 4:** Activation remains consistently low (approximately 0-0.001) across all steps.
* **Layer 5:** Activation begins to increase gradually with steps, reaching approximately 0.002 at 300k steps.
* **Layer 6:** Activation increases more rapidly with steps, reaching approximately 0.004 at 300k steps.
* **Layer 7:** Activation increases rapidly with steps, reaching approximately 0.006 at 300k steps.
* **Layer 8:** Activation increases rapidly with steps, reaching approximately 0.007 at 300k steps.
* **Layer 9:** Activation peaks around 210k-240k steps, reaching approximately 0.008, then slightly decreases.
* **Layer 10:** Activation peaks around 210k-240k steps, reaching approximately 0.008, then slightly decreases.
* **Layer 11:** Activation peaks around 210k-240k steps, reaching approximately 0.008, then slightly decreases.
* **Layer 12:** Activation peaks around 210k-240k steps, reaching approximately 0.008, then slightly decreases.
The highest activation levels (around 0.008) are concentrated in layers 9, 10, 11, and 12, specifically between 210k and 240k steps. The activation appears to plateau or slightly decrease after these steps.
### Key Observations
* Early layers (1-5) exhibit consistently low activation throughout training.
* Activation increases with both layer number and training steps.
* Layers 9-12 show the highest activation levels, suggesting these layers are most actively involved in the model's learning process.
* There's a potential saturation effect in layers 9-12 after approximately 240k steps, where activation levels plateau or slightly decrease.
### Interpretation
This heatmap likely represents the activation of neurons in different layers of a neural network during training. The increasing activation with both layer number and training steps suggests that deeper layers become more engaged as the model learns. The peak activation in layers 9-12 indicates that these layers are crucial for the model's final output or decision-making process.
The plateau or slight decrease in activation after 240k steps in the later layers could indicate several things:
1. **Convergence:** The model may be converging, and further training doesn't significantly improve activation in these layers.
2. **Overfitting:** The model might be starting to overfit the training data, leading to diminishing returns in activation.
3. **Vanishing/Exploding Gradients:** Although less likely given the overall trend, it's possible that gradient issues are affecting activation in these layers.
The fact that the earlier layers remain relatively inactive throughout training suggests they might be responsible for extracting basic features, while the later layers combine these features to form more complex representations. Further analysis, such as examining the weights and gradients of each layer, would be needed to confirm these interpretations.