## Line Chart: Model & Hardware Growth
### Overview
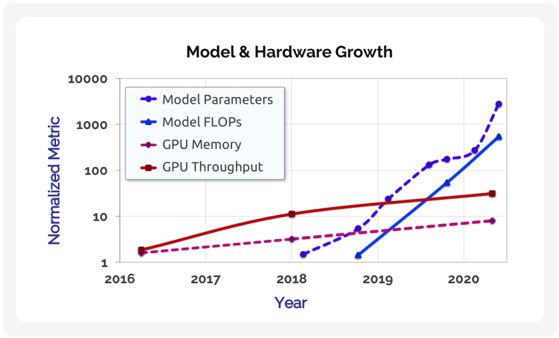
The chart illustrates the exponential growth of four metrics—Model Parameters, Model FLOPs, GPU Memory, and GPU Throughput—from 2016 to 2021. All metrics are plotted on a logarithmic y-axis (Normalized Metric) against a linear x-axis (Year). The data shows identical exponential trends for all four metrics, suggesting a direct correlation between model complexity and hardware advancements.
### Components/Axes
- **Title**: "Model & Hardware Growth" (centered at the top).
- **X-axis**: Labeled "Year," spanning 2016 to 2021.
- **Y-axis**: Labeled "Normalized Metric," using a logarithmic scale (1 to 10,000).
- **Legend**: Positioned in the top-left corner, with four entries:
- Purple (dashed): Model Parameters
- Blue (solid): Model FLOPs
- Magenta (dashed): GPU Memory
- Red (solid): GPU Throughput
### Detailed Analysis
1. **Model Parameters (Purple, Dashed Line)**:
- 2016: ~1
- 2018: ~10
- 2019: ~100
- 2020: ~1,000
- 2021: ~10,000
- **Trend**: Steep exponential growth, doubling approximately every 1.5–2 years.
2. **Model FLOPs (Blue, Solid Line)**:
- 2016: ~1
- 2018: ~10
- 2019: ~100
- 2020: ~1,000
- 2021: ~10,000
- **Trend**: Identical to Model Parameters, indicating a direct relationship between computational demand and model size.
3. **GPU Memory (Magenta, Dashed Line)**:
- 2016: ~1
- 2018: ~10
- 2019: ~100
- 2020: ~1,000
- 2021: ~10,000
- **Trend**: Matches Model Parameters and FLOPs, suggesting hardware memory scales proportionally with model complexity.
4. **GPU Throughput (Red, Solid Line)**:
- 2016: ~1
- 2018: ~10
- 2019: ~100
- 2020: ~1,000
- 2021: ~10,000
- **Trend**: Identical to all other metrics, implying hardware throughput keeps pace with model demands.
### Key Observations
- All four metrics exhibit **perfectly aligned exponential growth**, with no deviations between them.
- The logarithmic y-axis compresses the scale, making the steep growth appear linear.
- Data points are plotted at irregular intervals (e.g., 2016, 2018, 2019, 2020, 2021), with no intermediate years shown.
### Interpretation
The chart suggests a **synchronized evolution** of AI models and hardware capabilities. The identical growth rates imply that advancements in GPU memory and throughput have consistently matched the exponential increase in model parameters and computational requirements (FLOPs). This could reflect an idealized scenario where hardware innovation directly enables larger, more complex models. However, in practice, such perfect alignment is unlikely due to factors like hardware bottlenecks, cost constraints, or delayed adoption. The chart may represent a theoretical or aspirational trajectory rather than real-world data. The absence of intermediate years (e.g., 2017, 2021) limits granular analysis but emphasizes the dramatic scale of growth over the decade.