\n
## Line Chart: Model & Hardware Growth
### Overview
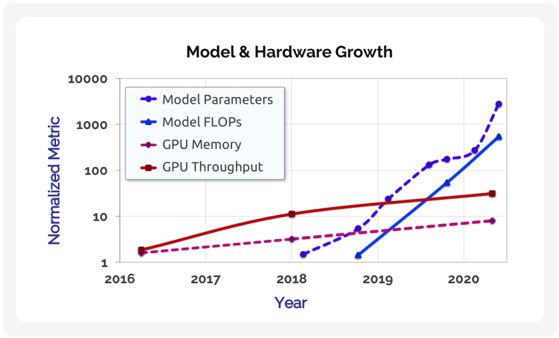
The image presents a line chart illustrating the growth of model parameters, model FLOPS (Floating Point Operations Per Second), GPU memory, and GPU throughput from 2016 to 2020. The y-axis is a normalized metric on a logarithmic scale, ranging from 1 to 10000, while the x-axis represents the year. The chart aims to demonstrate the relative growth rates of these four key components in the field of machine learning and hardware.
### Components/Axes
* **Title:** Model & Hardware Growth
* **X-axis:** Year (2016, 2017, 2018, 2019, 2020)
* **Y-axis:** Normalized Metric (Logarithmic scale from 1 to 10000)
* **Legend:**
* Model Parameters (Blue)
* Model FLOPS (Dark Blue)
* GPU Memory (Magenta)
* GPU Throughput (Red)
### Detailed Analysis
The chart displays four distinct lines, each representing a different metric over the five-year period.
* **Model Parameters (Blue):** This line starts at approximately 2 in 2016 and exhibits a relatively slow, steady increase until 2018, reaching around 8. From 2019 onwards, the line experiences exponential growth, reaching approximately 500 in 2019 and then soaring to approximately 2000 in 2020.
* **Model FLOPS (Dark Blue):** This line begins at approximately 1 in 2016 and shows a similar pattern to Model Parameters, with a gradual increase until 2018, reaching around 5. It then experiences rapid growth in 2019, reaching approximately 100, and continues to grow significantly in 2020, reaching approximately 800.
* **GPU Memory (Magenta):** This line starts at approximately 1.5 in 2016 and increases steadily, but at a slower rate than the other two lines. It reaches approximately 10 in 2019 and approximately 12 in 2020.
* **GPU Throughput (Red):** This line begins at approximately 2 in 2016 and shows a consistent, but moderate, upward trend. It reaches approximately 12 in 2018, approximately 20 in 2019, and approximately 25 in 2020.
### Key Observations
* Model Parameters and Model FLOPS exhibit the most dramatic growth, particularly from 2019 to 2020, indicating a significant increase in model complexity and computational requirements.
* GPU Memory growth is relatively slow compared to the other metrics, suggesting that memory capacity may be a limiting factor.
* GPU Throughput shows steady growth, but at a slower pace than Model Parameters and FLOPS, indicating that hardware improvements are not keeping pace with the increasing demands of larger models.
* The logarithmic scale emphasizes the exponential growth of Model Parameters and FLOPS.
### Interpretation
The data suggests a clear trend of increasing model complexity and computational demands in the field of machine learning. The rapid growth of Model Parameters and FLOPS, coupled with the slower growth of GPU Memory and Throughput, indicates that hardware is becoming a bottleneck. This could drive further innovation in hardware design to meet the demands of increasingly sophisticated models. The chart highlights the importance of both algorithmic advancements (increasing model size and complexity) and hardware improvements (increasing memory and throughput) for continued progress in the field. The divergence between model growth and hardware growth suggests a potential future where hardware limitations could constrain the development of even larger and more powerful models. The logarithmic scale is crucial for understanding the magnitude of the changes; linear scales would obscure the exponential growth of the model parameters and FLOPS.