## Line Chart: Model & Hardware Growth
### Overview
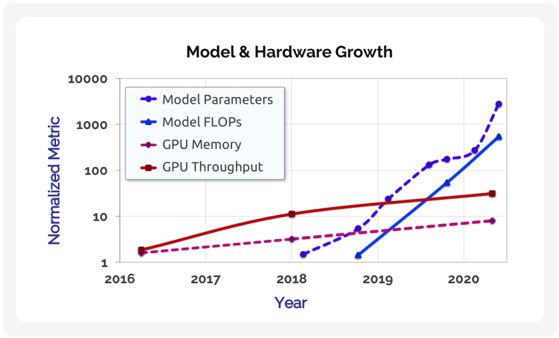
This is a line chart titled "Model & Hardware Growth" that plots the normalized growth of four key metrics in artificial intelligence and computing hardware over a period from 2016 to 2020. The chart uses a logarithmic scale on the y-axis to visualize exponential growth trends across different orders of magnitude.
### Components/Axes
* **Title:** "Model & Hardware Growth" (centered at the top).
* **X-Axis:** Labeled "Year". Major tick marks are present for the years 2016, 2017, 2018, 2019, and 2020.
* **Y-Axis:** Labeled "Normalized Metric". It is a logarithmic scale with major gridlines and labels at 1, 10, 100, 1000, and 10000.
* **Legend:** Located in the top-left quadrant of the chart area. It contains four entries, each with a colored line and marker symbol:
* **Blue dashed line with diamond markers:** "Model Parameters"
* **Blue solid line with square markers:** "Model FLOPs"
* **Purple dashed line with circle markers:** "GPU Memory"
* **Red solid line with circle markers:** "GPU Throughput"
### Detailed Analysis
The chart displays four distinct data series, each showing a growth trend from its starting point to 2020. All values are normalized, likely to a baseline value of 1 at their respective starting points.
1. **Model Parameters (Blue dashed line, diamond markers):**
* **Trend:** Shows the steepest, near-exponential upward slope, especially after 2018.
* **Data Points (Approximate):**
* 2018: ~1.5
* 2019: ~20
* 2020: ~3000
* **Spatial Grounding:** This line ends at the highest point on the chart, in the top-right corner.
2. **Model FLOPs (Blue solid line, square markers):**
* **Trend:** Also shows a very steep, exponential upward trend, closely following but slightly below the "Model Parameters" line in later years.
* **Data Points (Approximate):**
* 2019: ~1.2
* 2020: ~600
* **Spatial Grounding:** This line originates later than the others (around 2019) and ends just below the "Model Parameters" line in the top-right.
3. **GPU Throughput (Red solid line, circle markers):**
* **Trend:** Shows a steady, approximately linear increase on this log-scale chart, indicating consistent exponential growth but at a slower rate than the model metrics.
* **Data Points (Approximate):**
* 2016: ~2
* 2018: ~12
* 2020: ~30
* **Spatial Grounding:** This is the highest line on the chart from 2016 until about 2019, when it is overtaken by the model metrics. It ends in the middle-right area.
4. **GPU Memory (Purple dashed line, circle markers):**
* **Trend:** Shows the slowest growth rate of the four metrics, with a gentle upward slope.
* **Data Points (Approximate):**
* 2016: ~2
* 2018: ~3
* 2020: ~8
* **Spatial Grounding:** This is the lowest line on the chart for the entire duration, ending in the bottom-right area.
### Key Observations
* **Diverging Growth Rates:** There is a dramatic divergence between the growth of AI model complexity (Parameters and FLOPs) and the growth of underlying hardware capabilities (GPU Memory and Throughput). The model metrics grow by roughly three orders of magnitude (~1000x) from 2018/2019 to 2020, while hardware metrics grow by less than one order of magnitude (~4-15x) over the same period.
* **Crossover Point:** Around late 2019, the "Model Parameters" and "Model FLOPs" lines cross above the "GPU Throughput" line, indicating that the scale of models began to outpace the growth in hardware processing power.
* **Logarithmic Scale Necessity:** The use of a log scale is essential to visualize all four trends simultaneously, as the values span from single digits to thousands.
### Interpretation
This chart visually demonstrates a central challenge in modern AI development: the **scalability gap**. The data suggests that the size and computational requirements of state-of-the-art AI models (proxied by Parameters and FLOPs) are growing at a significantly faster rate than the capabilities of the hardware (GPUs) designed to run them.
The implications are profound:
1. **Efficiency Pressure:** This divergence creates intense pressure for algorithmic and hardware efficiency innovations (e.g., new model architectures, quantization, specialized chips) to close the gap.
2. **Resource Concentration:** Training the largest models likely becomes increasingly concentrated among entities with access to vast, cutting-edge computational resources.
3. **Sustainability Questions:** The trend raises questions about the long-term sustainability of purely scaling model size as a path to improved performance, given the slower growth of hardware and associated energy costs.
The chart does not show a plateau in model growth, suggesting that, as of 2020, the field was still in a phase of aggressive scaling. The "GPU Memory" line being the lowest highlights memory capacity as a particularly acute bottleneck for accommodating ever-larger models.