## Diagram: Belief Tree Example
### Overview
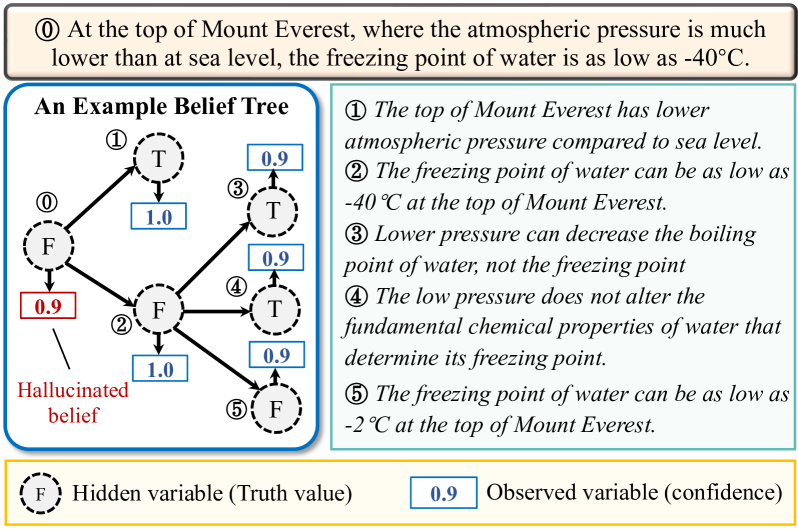
The image presents an example of a belief tree, illustrating how beliefs can be structured and how confidence levels are assigned to different variables. It also includes textual explanations related to the freezing point of water at high altitudes and the impact of pressure.
### Components/Axes
* **Title:** "An Example Belief Tree"
* **Nodes:** Represented by circles, labeled with either "T" (True) or "F" (False). These are "Hidden variables (Truth value)" as indicated by the legend. The circles have dashed outlines.
* **Edges:** Represented by arrows, indicating the flow of belief or influence.
* **Observed Variables:** Represented by blue rectangles, containing numerical values (confidence levels). These are "Observed variable (confidence)" as indicated by the legend.
* **Hallucinated Belief:** A red rectangle containing a numerical value, connected to a node with an arrow and labeled as "Hallucinated belief".
* **Legend:** Located at the bottom of the diagram, explaining the meaning of the circle and rectangle symbols.
* **Explanatory Text:** Located to the right of the belief tree, providing numbered statements related to the concepts illustrated in the tree.
* **Introductory Text:** Located at the top of the diagram, providing context about the freezing point of water at the top of Mount Everest.
### Detailed Analysis
**1. Introductory Text (Top):**
* "At the top of Mount Everest, where the atmospheric pressure is much lower than at sea level, the freezing point of water is as low as -40°C."
**2. Belief Tree Structure (Left):**
* The belief tree consists of nodes representing truth values (T/F) and edges representing relationships between them.
* Node 0 (F) is at the top-left. It connects to Node 1 (T) and Node 2 (F).
* Node 1 (T) has an observed variable with a confidence of 1.0.
* Node 2 (F) has an observed variable with a confidence of 1.0.
* Node 2 (F) connects to Node 3 (T), Node 4 (T), and Node 5 (F).
* Node 3 (T) has an observed variable with a confidence of 0.9.
* Node 4 (T) has an observed variable with a confidence of 0.9.
* Node 5 (F) has an observed variable with a confidence of 0.9.
* Node 0 (F) has a "Hallucinated belief" with a confidence of 0.9. This is colored red.
**3. Explanatory Text (Right):**
The text provides five statements:
1. "The top of Mount Everest has lower atmospheric pressure compared to sea level."
2. "The freezing point of water can be as low as -40°C at the top of Mount Everest."
3. "Lower pressure can decrease the boiling point of water, not the freezing point."
4. "The low pressure does not alter the fundamental chemical properties of water that determine its freezing point."
5. "The freezing point of water can be as low as -2°C at the top of Mount Everest."
**4. Legend (Bottom):**
* "F Hidden variable (Truth value)" - Represents the nodes in the belief tree.
* "0.9 Observed variable (confidence)" - Represents the confidence levels associated with the nodes.
### Key Observations
* The belief tree illustrates a chain of reasoning, where the truth value of one node influences the truth values of subsequent nodes.
* The confidence levels indicate the degree of certainty associated with each node.
* The "Hallucinated belief" suggests a belief that is not supported by the evidence in the tree.
* The explanatory text provides context and clarifies the concepts illustrated in the belief tree.
* The freezing point of water at the top of Mount Everest is stated as -40°C in the introductory text and statement 2, but statement 5 states it can be as low as -2°C. This discrepancy suggests a potential inconsistency or different interpretations of the freezing point under specific conditions.
### Interpretation
The diagram illustrates a simplified model of belief propagation and reasoning. The belief tree represents a network of interconnected beliefs, where the confidence in each belief is quantified. The "Hallucinated belief" highlights the potential for errors or biases in reasoning. The explanatory text provides context and helps to interpret the meaning of the belief tree. The discrepancy in the freezing point of water at the top of Mount Everest suggests that the model may not fully capture the complexity of the real-world phenomenon. The diagram demonstrates how belief networks can be used to model and analyze reasoning processes, but also highlights the importance of considering potential biases and inconsistencies.