\n
## Diagram: Belief Tree Example
### Overview
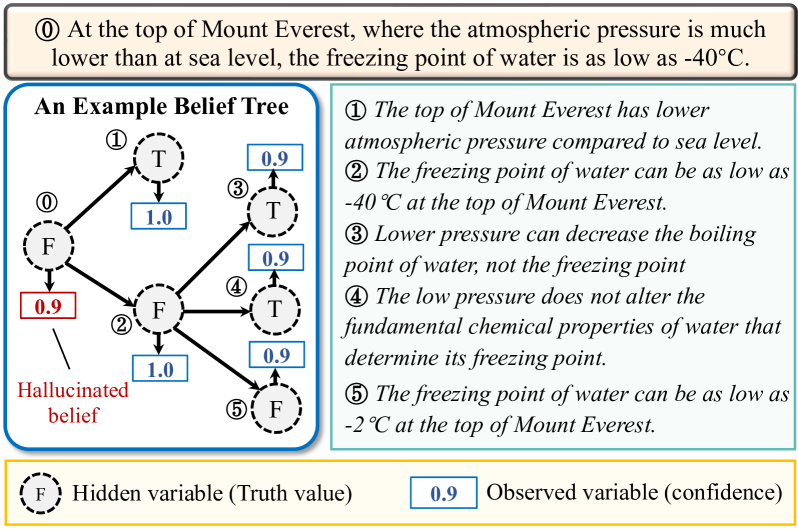
The image presents a diagram illustrating a "Belief Tree" with associated textual explanations. The diagram depicts a network of nodes representing beliefs, their truth values (T/F), and confidence levels. The diagram is accompanied by a numbered list of statements explaining the beliefs represented in the tree.
### Components/Axes
The diagram consists of:
* **Nodes:** Representing beliefs, colored orange or blue.
* **Arrows:** Indicating relationships between beliefs.
* **Labels:** "T" (True) and "F" (False) indicating truth values.
* **Confidence Values:** Numerical values (0.9, 1.0) associated with the edges, representing confidence levels.
* **Legend:** Explaining the meaning of "F" (Hidden variable - Truth value) and "0.9" (Observed variable - confidence).
* **Text Blocks:** Numbered statements (1-5) explaining the beliefs.
* **Annotation:** "Hallucinated belief" pointing to a specific node.
* **Header:** "An Example Belief Tree"
* **Introductory Text:** "At the top of Mount Everest, where the atmospheric pressure is much lower than at sea level, the freezing point of water is as low as -40°C."
### Detailed Analysis or Content Details
**Diagram Analysis:**
The belief tree starts with an initial node (Node 0) which splits into two branches: one leading to a "True" node (Node 1) and another to a "False" node (Node 2).
* **Node 0 to Node 1:** Arrow with confidence value 1.0, leading to a "T" node.
* **Node 0 to Node 2:** Arrow with confidence value 0.9, leading to an "F" node.
* **Node 1 to Node 3:** Arrow with confidence value 0.9, leading to a "T" node.
* **Node 2 to Node 4:** Arrow with confidence value 1.0, leading to an "F" node.
* **Node 3 to Node 5:** Arrow with confidence value 0.9, leading to an "F" node.
* **Node 4 to Node 5:** Arrow with confidence value 0.9, leading to an "F" node.
The "Hallucinated belief" annotation points to the "F" node (Node 2).
**Text Block Analysis:**
1. "The top of Mount Everest has lower atmospheric pressure compared to sea level."
2. "The freezing point of water can be as low as -40°C at the top of Mount Everest."
3. "Lower pressure can decrease the boiling point of water, not the freezing point"
4. "The low pressure does not alter the fundamental chemical properties of water that determine its freezing point."
5. "The freezing point of water can be as low as -2°C at the top of Mount Everest."
### Key Observations
* The diagram illustrates how a belief can branch into true and false possibilities, with associated confidence levels.
* The "Hallucinated belief" suggests a potential error or unsupported belief within the system.
* The confidence values are not uniformly high, indicating varying degrees of certainty in the beliefs.
* The text blocks provide context and justification for the beliefs represented in the tree.
* There is a contradiction between statements 2 and 5 regarding the freezing point of water at Mount Everest (-40°C vs -2°C).
### Interpretation
The diagram demonstrates a simplified model of belief propagation and reasoning. The tree structure represents a chain of inferences, where each node represents a belief and the edges represent the relationships between them. The confidence values quantify the strength of these relationships. The "Hallucinated belief" highlights the potential for errors in the reasoning process.
The contradiction in the text blocks (statements 2 and 5) suggests a potential inconsistency in the knowledge base or a flaw in the reasoning process. This could be due to incomplete information, inaccurate assumptions, or errors in the inference rules.
The diagram and accompanying text are likely intended to illustrate the challenges of building reliable and accurate belief systems, particularly in complex domains where information is uncertain or incomplete. The example of Mount Everest and the freezing point of water serves as a concrete illustration of how environmental factors can influence physical properties and how these factors must be considered in reasoning about the world. The diagram is a visual representation of a logical argument, and the confidence values represent the strength of the evidence supporting each step in the argument.