## Belief Tree Diagram: Freezing Point of Water at Mount Everest
### Overview
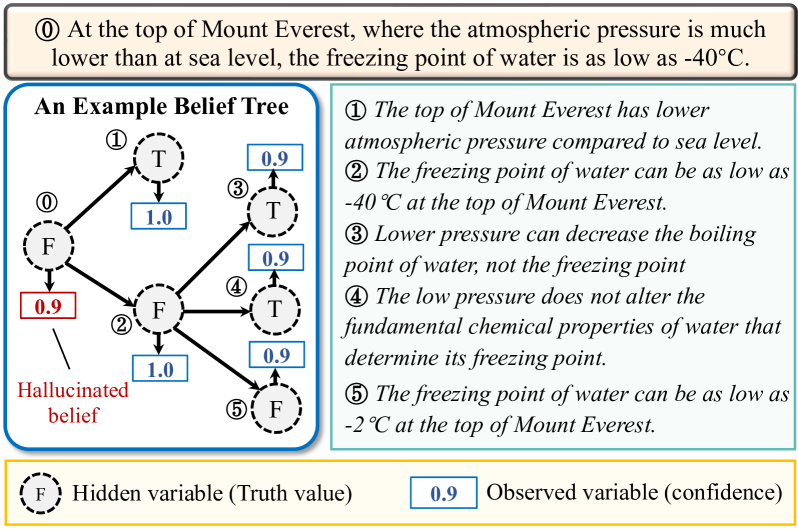
The image presents a belief tree diagram illustrating the relationship between atmospheric pressure, freezing point of water, and confidence values. It includes explanatory text about Mount Everest's conditions and a legend defining hidden/observed variables. The diagram uses probabilistic connections (0.9, 1.0) between nodes labeled "T" (True) and "F" (False), with a highlighted "Hallucinated belief" path.
### Components/Axes
1. **Header**: Text box stating "At the top of Mount Everest... freezing point of water is as low as -40°C."
2. **Belief Tree Diagram**:
- **Nodes**:
- 6 circular nodes labeled "T" (True) or "F" (False)
- Arrows between nodes with probabilities (0.9, 1.0)
- **Highlighted Path**: Red arrow labeled "Hallucinated belief" connecting F→F→F
- **Confidence Values**: Blue boxes with "0.9" and "1.0" near nodes
3. **Explanatory Text**: 5 numbered points about atmospheric pressure and freezing point relationships
4. **Footer**: Legend explaining:
- "F" = Hidden variable (Truth value)
- "0.9" = Observed variable (confidence)
### Detailed Analysis
1. **Belief Tree Structure**:
- Root node (F) branches to two paths:
- Path 1: F→T (prob 1.0)→T (prob 0.9)
- Path 2: F→F (prob 1.0)→F (prob 0.9)→F (prob 0.9)
- "Hallucinated belief" path shows decreasing confidence (0.9→0.9→0.9)
- All terminal nodes have confidence ≥0.9
2. **Explanatory Text Content**:
- Point 1: Lower atmospheric pressure at Everest's summit
- Point 2: Freezing point can reach -40°C at Everest's top
- Point 3: Lower pressure affects boiling point, not freezing point
- Point 4: Chemical properties of water remain unchanged
- Point 5: Freezing point can be as low as -2°C (contradicts Point 2?)
3. **Legend**:
- F (dashed circle): Hidden variable (Truth value)
- 0.9 (blue box): Observed variable (confidence)
### Key Observations
1. Contradiction between Point 2 (-40°C) and Point 5 (-2°C) freezing point claims
2. "Hallucinated belief" path maintains high confidence (0.9) despite being labeled as hallucinated
3. All terminal nodes have confidence ≥0.9, suggesting strong certainty in conclusions
4. Probabilistic connections show deterministic paths (1.0 probabilities) in some branches
### Interpretation
The diagram attempts to model the relationship between atmospheric pressure and freezing point at high altitudes, but contains contradictory claims about freezing point temperatures (-40°C vs -2°C). The "Hallucinated belief" path's high confidence values suggest either:
1. Overconfidence in incorrect assumptions
2. A flaw in the model's confidence calibration
3. Ambiguity in what constitutes "hallucination" in this context
The belief tree's structure implies that lower pressure (F→F) leads to lower freezing points (F→F→F), but the explanatory text contradicts this by stating both -40°C and -2°C as possible values. This inconsistency highlights the challenge of modeling complex physical phenomena with simplified probabilistic models, particularly when dealing with counterintuitive scientific concepts like phase changes under extreme conditions.