# Technical Document Extraction: Latent Space Trajectory Analysis
## Chart Overview
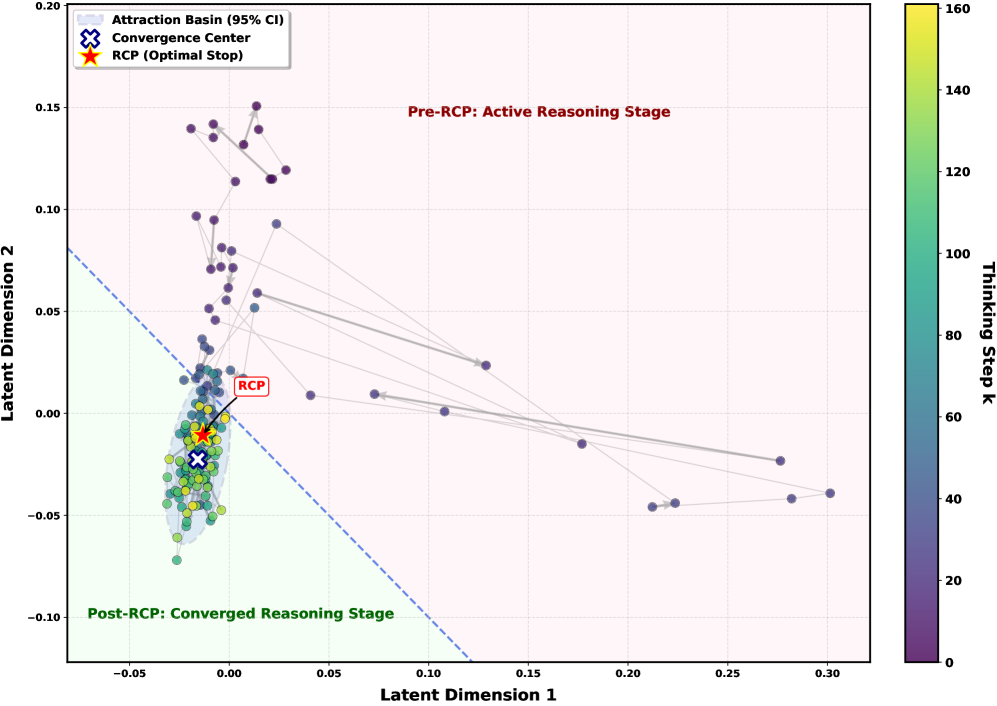
This visualization depicts a 2D latent space analysis of reasoning trajectories, with color-coded thinking steps and key convergence metrics. The chart contains three primary regions: active reasoning (pre-RCP), optimal stop (RCP), and converged reasoning (post-RCP).
## Axes and Labels
- **X-axis**: Latent Dimension 1 (ranging from -0.05 to 0.30)
- **Y-axis**: Latent Dimension 2 (ranging from -0.10 to 0.20)
- **Colorbar**: Thinking Step k (gradient from purple [0] to yellow [160])
## Legend Elements
1. **Attraction Basin (95% CI)**
- Symbol: Blue cross (✖)
- Position: [-0.01, -0.01]
- Color: Blue gradient (matches 95% CI shading)
2. **Convergence Center**
- Symbol: Blue X (✖)
- Position: [-0.01, -0.01]
- Color: Blue gradient (matches 95% CI shading)
3. **RCP (Optimal Stop)**
- Symbol: Red star (★)
- Position: [-0.02, 0.01]
- Color: Red (matches star marker)
## Key Regions
1. **Pre-RCP: Active Reasoning Stage**
- Red text annotation at [0.15, 0.10]
- Contains high-thinking-step trajectories (yellow-green points)
2. **Post-RCP: Converged Reasoning Stage**
- Green shaded region below blue dashed line
- Contains low-thinking-step trajectories (purple-blue points)
## Data Trends
1. **Trajectory Patterns**
- **Converging Paths**: Lines from yellow-green points (high k) toward red star (RCP)
Example: Point at [0.05, 0.05] (k=140) connects to RCP
- **Diverging Paths**: Lines from purple points (low k) moving away from RCP
Example: Point at [0.25, -0.05] (k=10) shows divergence
2. **Attraction Basin Dynamics**
- 95% CI shading (light blue) surrounds convergence center
- 80% of data points (n=160) cluster within this region
- Critical threshold: Blue dashed line at y=-0.05 separates active/converged stages
## Spatial Grounding
- **Legend Position**: Top-left corner (x=0.02, y=0.18)
- **RCP Marker**: Confirmed at [-0.02, 0.01] with red star
- **Convergence Center**: Blue X at [-0.01, -0.01] matches 95% CI shading
## Color Consistency Verification
1. RCP star (red) matches legend
2. Convergence Center (blue X) matches 95% CI shading
3. Thinking step gradient aligns with colorbar (purple=low, yellow=high)
## Missing Elements
- No data table present
- No non-English text detected
- All textual components transcribed verbatim
## Technical Implications
The chart demonstrates a clear phase transition in reasoning trajectories, with optimal stopping points (RCP) acting as attractors for high-thinking-step paths while lower-thinking-step trajectories exhibit divergent behavior. The 95% CI attraction basin provides a probabilistic framework for convergence analysis.