\n
## Diagram: Network Topology Illustration
### Overview
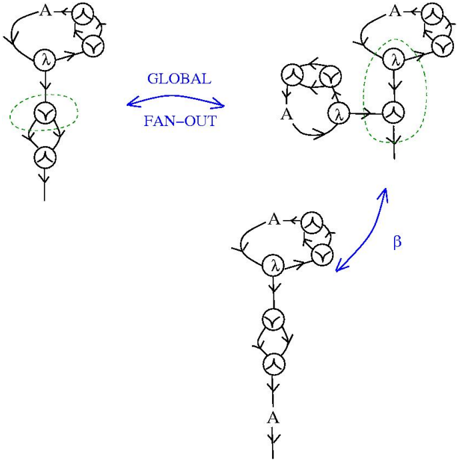
The image presents a diagram illustrating three different network topologies, likely representing variations in data flow or processing pathways. The diagrams consist of interconnected nodes labeled 'A' and 'λ' (lambda), with arrows indicating the direction of flow. The diagrams are arranged in a triangular pattern, with two diagrams positioned at the top and one at the bottom. Arrows labeled "GLOBAL" and "β" connect the diagrams, indicating relationships or transformations between them. Certain sections within the diagrams are highlighted with dotted green outlines.
### Components/Axes
The diagram utilizes the following components:
* **Nodes:** Represented by circles, labeled 'A' and 'λ'.
* **Arrows:** Indicate the direction of flow or connection between nodes.
* **Labels:** "GLOBAL", "FAN-OUT", "β".
* **Green Outlines:** Highlight specific sections within the diagrams.
There are no axes in this diagram.
### Detailed Analysis or Content Details
**Diagram 1 (Top-Left):**
* The diagram starts with a node labeled 'A'.
* 'A' connects to a series of three nodes, the middle one labeled 'λ'.
* The nodes are interconnected with circular arrows, creating a loop.
* The bottom node connects to an output arrow.
* A section containing the 'λ' node and two adjacent nodes is enclosed in a dotted green outline.
**Diagram 2 (Top-Right):**
* The diagram begins with a node labeled 'A'.
* 'A' connects to a series of three nodes, the middle one labeled 'λ'.
* The nodes are interconnected with circular arrows, creating a loop.
* The bottom node connects to an output arrow.
* A section containing the 'λ' node and two adjacent nodes is enclosed in a dotted green outline.
* An arrow labeled "GLOBAL" points from this diagram to Diagram 1.
**Diagram 3 (Bottom):**
* The diagram starts with a node labeled 'λ'.
* 'λ' connects to a series of three nodes, the bottom one labeled 'A'.
* The nodes are interconnected with circular arrows, creating a loop.
* The bottom node connects to an output arrow.
* A section containing the 'λ' node and two adjacent nodes is enclosed in a dotted green outline.
* An arrow labeled "β" points from this diagram to Diagram 2.
* An arrow labeled "FAN-OUT" points from Diagram 1 to Diagram 3.
### Key Observations
* All three diagrams share a similar structure, involving nodes 'A' and 'λ' connected in a looped arrangement.
* The green outlines consistently highlight a specific section of the network, potentially indicating a critical processing unit or a region of interest.
* The arrows "GLOBAL", "FAN-OUT", and "β" suggest a relationship between the diagrams, possibly representing data transformation or flow control.
* The "FAN-OUT" arrow indicates that Diagram 1 feeds into Diagram 3.
* The "GLOBAL" arrow indicates that Diagram 2 feeds into Diagram 1.
* The "β" arrow indicates that Diagram 3 feeds into Diagram 2.
### Interpretation
The diagram likely represents different configurations of a network or processing system. The nodes 'A' and 'λ' could represent different types of processing units or data elements. The loops suggest iterative processing or feedback mechanisms. The arrows "GLOBAL", "FAN-OUT", and "β" indicate how these configurations interact with each other.
The "FAN-OUT" arrow suggests a branching or distribution of data from Diagram 1 to Diagram 3. The "GLOBAL" arrow suggests a feedback loop or global control mechanism from Diagram 2 to Diagram 1. The "β" arrow suggests a transformation or adjustment of data from Diagram 3 to Diagram 2.
The green outlines may highlight a specific component or sub-network that is common to all three configurations, suggesting its importance in the overall system. The diagram could be illustrating different stages of a process, different levels of abstraction, or different optimization strategies. The overall structure suggests a complex system with interconnected components and feedback loops.