## Pie Charts: Error Analysis of LLM Performance
### Overview
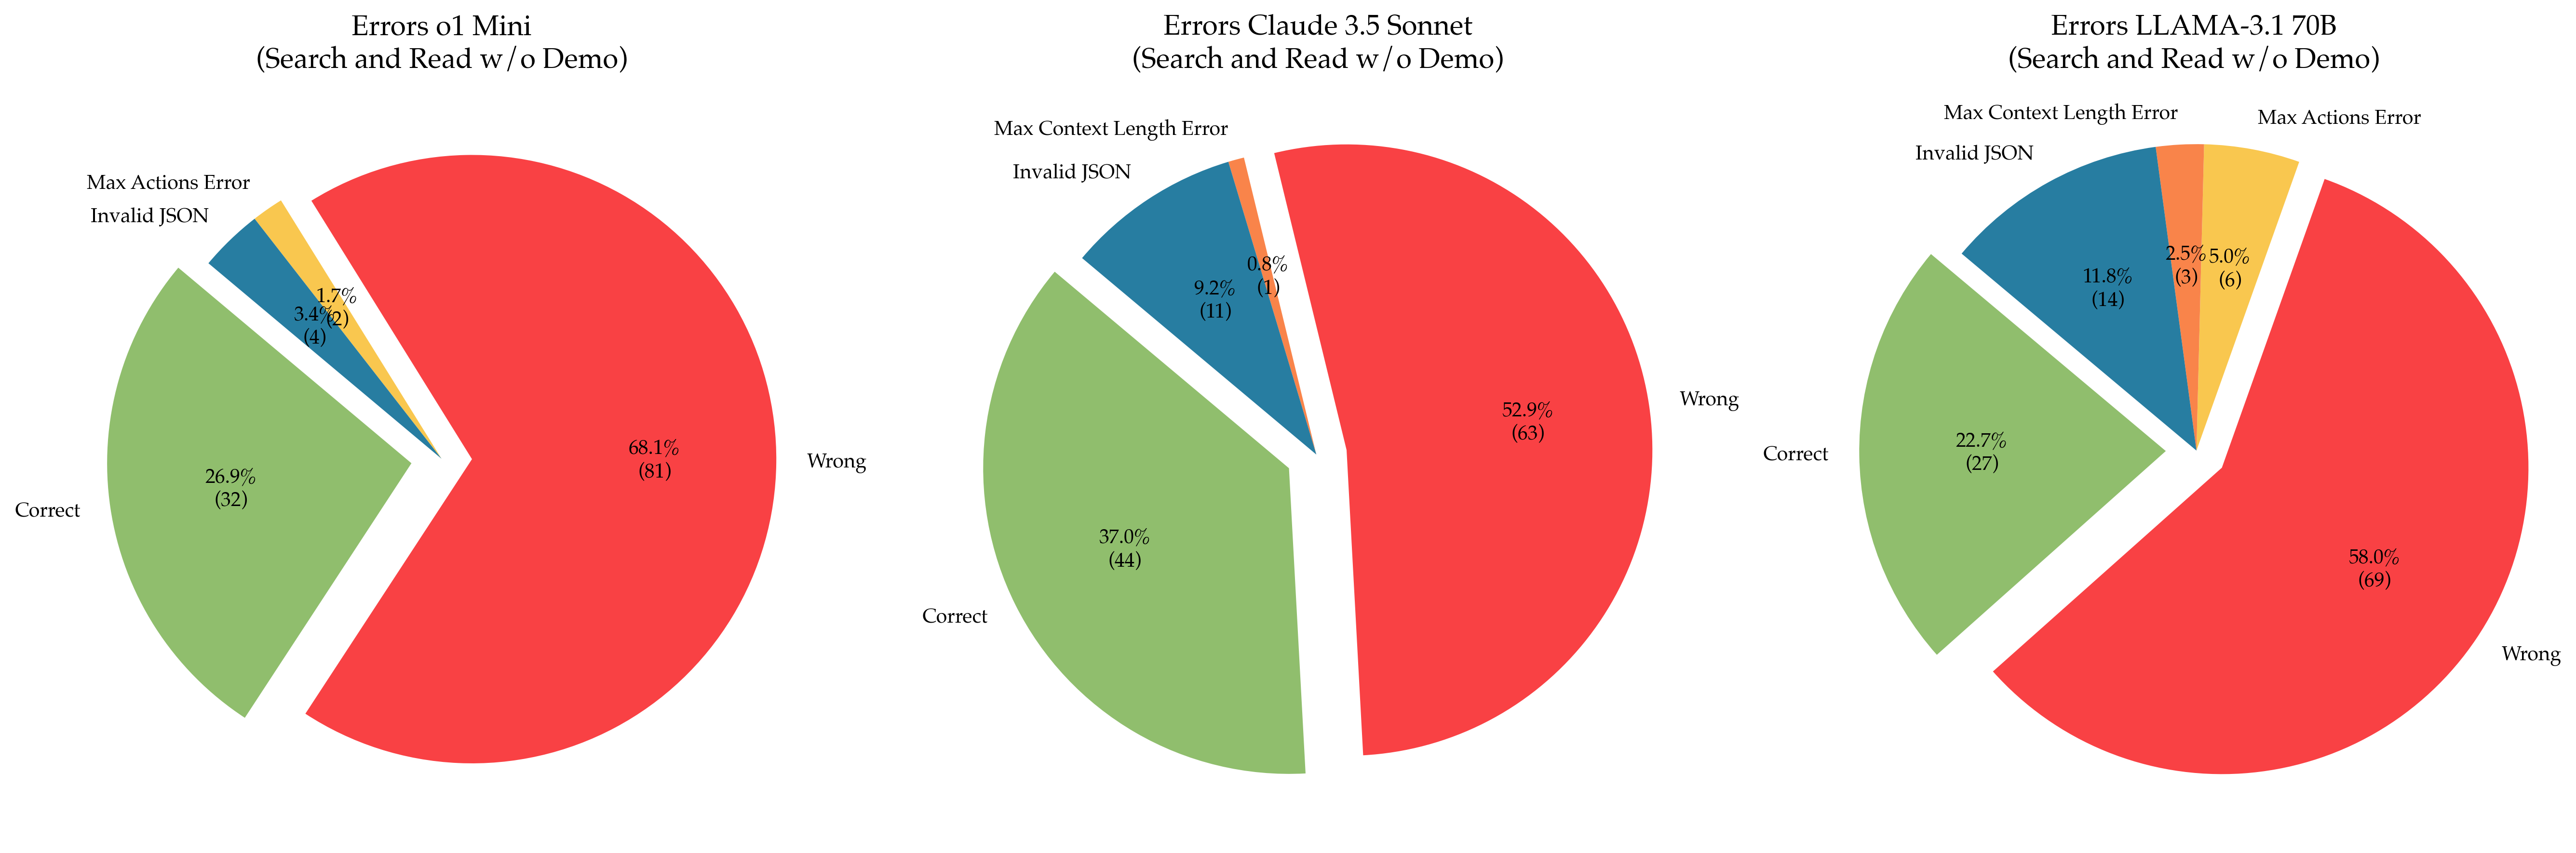
The image presents three pie charts comparing the error types of three different Large Language Models (LLMs): `ol 1 Mini`, `Claude 3.5 Sonnet`, and `LLAMA-3-170B`. All models were evaluated on "Search and Read w/o Demo" tasks. Each pie chart visualizes the distribution of errors into four categories: "Correct", "Wrong", "Max Context Length Error", and "Invalid JSON". The charts also display the percentage and count of each error type.
### Components/Axes
Each chart has the following components:
* **Title:** Indicates the LLM being analyzed (e.g., "Errors ol 1 Mini (Search and Read w/o Demo)")
* **Pie Slices:** Represent the proportion of each error type.
* **Labels:** Each slice is labeled with the error type and its percentage and count (e.g., "Correct 26.9% (32)").
* **Color Coding:** Each error type is assigned a specific color:
* Correct: Green
* Wrong: Red
* Max Context Length Error: Blue
* Invalid JSON: Pink
### Detailed Analysis or Content Details
**Chart 1: Errors ol 1 Mini (Search and Read w/o Demo)**
* **Correct:** 26.9% (32) - Green slice, occupying approximately one-quarter of the pie.
* **Wrong:** 68.1% (81) - Red slice, dominating the pie chart.
* **Max Context Length Error:** 1.7% (2) - Blue slice, a very small portion.
* **Invalid JSON:** 3.4% (4) - Pink slice, a small portion.
**Chart 2: Errors Claude 3.5 Sonnet (Search and Read w/o Demo)**
* **Correct:** 37.0% (44) - Green slice, slightly more than one-third of the pie.
* **Wrong:** 52.9% (63) - Red slice, the largest portion of the pie.
* **Max Context Length Error:** 0.8% (1) - Blue slice, a very small portion.
* **Invalid JSON:** 9.2% (11) - Pink slice, a noticeable portion.
**Chart 3: Errors LLAMA-3-170B (Search and Read w/o Demo)**
* **Correct:** 22.7% (27) - Green slice, less than one-quarter of the pie.
* **Wrong:** 58.0% (69) - Red slice, the largest portion of the pie.
* **Max Context Length Error:** 11.8% (14) - Blue slice, a significant portion.
* **Invalid JSON:** 2.5% (3) - Pink slice, a very small portion.
* **Max Actions Error:** 5.0% (6) - A new category, represented by a dark red slice.
### Key Observations
* All three models exhibit a significant proportion of "Wrong" answers, indicating a substantial error rate in the "Search and Read" task.
* `ol 1 Mini` has the highest percentage of "Wrong" answers (68.1%).
* `Claude 3.5 Sonnet` shows the highest percentage of "Correct" answers (37.0%) among the three models.
* `LLAMA-3-170B` has the highest percentage of "Max Context Length Error" (11.8%) and introduces a new error category, "Max Actions Error" (5.0%).
* "Invalid JSON" errors are relatively low for all models, except for `Claude 3.5 Sonnet` which has 9.2%.
### Interpretation
The data suggests that while all three LLMs struggle with the "Search and Read" task, their error profiles differ. `ol 1 Mini` is the least accurate overall, with the highest rate of incorrect responses. `Claude 3.5 Sonnet` demonstrates the best performance in terms of correct answers, but also has a notable number of "Invalid JSON" errors. `LLAMA-3-170B` exhibits a higher rate of errors related to context length and actions, potentially indicating limitations in handling complex queries or long-form responses. The introduction of "Max Actions Error" in `LLAMA-3-170B` suggests a specific failure mode related to the model's ability to execute actions based on the search results.
The differences in error types highlight the strengths and weaknesses of each model. The data could be used to inform model development efforts, focusing on addressing the specific error patterns observed for each LLM. For example, improving the context handling capabilities of `LLAMA-3-170B` or enhancing the JSON output generation of `Claude 3.5 Sonnet`.