\n
## Chart: Importance Score vs. Reasoning Step
### Overview
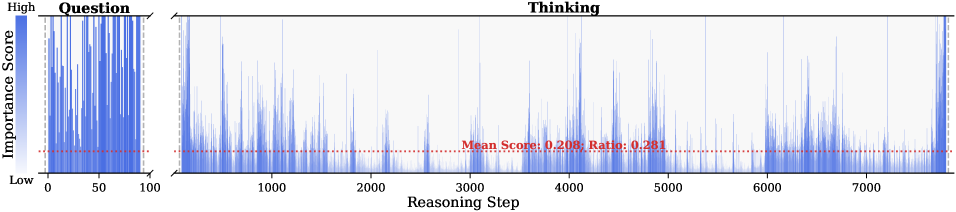
The image presents a chart visualizing the "Importance Score" over "Reasoning Step". The chart appears to represent the fluctuation of importance during a reasoning process, divided into "Question" and "Thinking" phases. A horizontal dotted line indicates the mean importance score and ratio.
### Components/Axes
* **X-axis:** "Reasoning Step", ranging from 0 to approximately 7200.
* **Y-axis:** "Importance Score", ranging from "Low" to "High". The scale is not numerically defined, but visually represents a relative importance level.
* **Chart Area:** The main area displaying the importance score fluctuations.
* **Phase Labels:** Two labels indicating phases: "Question" (from 0 to approximately 100 Reasoning Steps) and "Thinking" (from approximately 100 to 7200 Reasoning Steps).
* **Mean Score Line:** A horizontal dotted red line labeled "Mean Score: 0.208, Ratio: 0.281".
* **Color Scheme:** A blue color gradient is used to represent the importance score, with darker shades indicating higher scores.
### Detailed Analysis
The chart shows a distinct pattern in the importance score over the reasoning steps.
* **Question Phase (0-100 Reasoning Steps):** The importance score starts at a low level and rapidly increases to a high level within the first 100 reasoning steps. The score fluctuates significantly during this phase.
* **Thinking Phase (100-7200 Reasoning Steps):** After the initial "Question" phase, the importance score drops to a consistently low level, with frequent, small fluctuations. The score remains relatively stable around the mean score.
* **Mean Score:** The mean importance score is 0.208, with a ratio of 0.281. This line serves as a baseline for comparison.
* **Fluctuations in Thinking Phase:** The fluctuations in the "Thinking" phase are generally small, with the importance score rarely exceeding the mean score. There are occasional spikes, but they are short-lived.
* **Visual Trend:** The overall trend shows a sharp increase in importance during the "Question" phase, followed by a sustained low level of importance during the "Thinking" phase.
### Key Observations
* The "Question" phase is characterized by high importance and significant fluctuations.
* The "Thinking" phase is characterized by low, relatively stable importance.
* The mean importance score is low, suggesting that the reasoning process generally involves low importance levels.
* The ratio of 0.281 is not clearly defined in the context of the chart, but it may represent a normalized measure of importance.
### Interpretation
The chart suggests a two-stage reasoning process. The initial "Question" phase involves a rapid assessment of importance, likely related to identifying relevant information or formulating a problem. The subsequent "Thinking" phase involves a more sustained, but less intense, level of reasoning. The low mean importance score in the "Thinking" phase could indicate that the reasoning process involves a lot of background processing or exploration of less critical information. The sharp contrast between the two phases suggests a shift in cognitive focus. The ratio value may be a metric related to the proportion of high-importance steps within the reasoning process. The data suggests that the initial question-framing stage is significantly more important than the subsequent thinking stage, at least as measured by this "Importance Score".