## Line Chart: Importance Score Across Reasoning Steps
### Overview
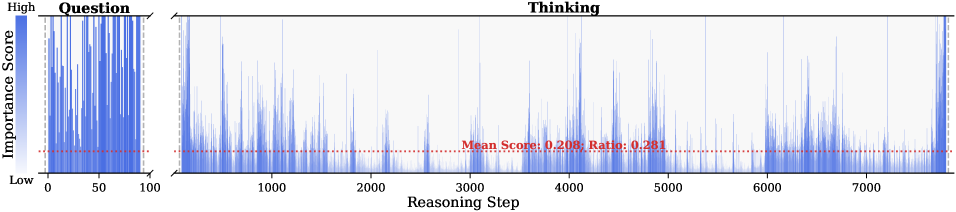
The image displays a line chart divided into two sections: "Question" (left) and "Thinking" (right). The chart visualizes the distribution of "Importance Score" across sequential "Reasoning Steps." The y-axis represents "Importance Score" with a gradient from light blue (low) to dark blue (high), while the x-axis spans "Reasoning Step" from 0 to 7000. A red dashed line labeled "Mean Score: 0.208; Ratio: 0.281" is overlaid on the "Thinking" section.
---
### Components/Axes
- **Y-Axis (Importance Score)**:
- Gradient scale from "Low" (light blue) to "High" (dark blue).
- No explicit numerical values, but the red dashed line provides a reference at ~0.208.
- **X-Axis (Reasoning Step)**:
- Linear scale from 0 to 7000.
- Divided into two sub-regions:
- **Question**: 0–100 (vertical bar chart).
- **Thinking**: 100–7000 (line chart).
- **Legend**:
- Implied by the y-axis gradient (no explicit legend box).
- Red dashed line represents the mean score and ratio.
---
### Detailed Analysis
#### Question Section (0–100)
- **Structure**: Vertical bars with varying heights.
- **Trend**:
- Bars are densely packed, with no clear pattern.
- Heights fluctuate, suggesting inconsistent importance scores.
- **Key Data**:
- No explicit numerical values, but the y-axis gradient indicates scores range from low to high.
#### Thinking Section (100–7000)
- **Structure**: Line chart with sharp spikes and troughs.
- **Trend**:
- Spikes (dark blue) indicate moments of high importance.
- Troughs (light blue) suggest periods of low importance.
- The red dashed line (mean score: 0.208) is consistently below most spikes, indicating most steps have low importance.
- **Key Data**:
- **Mean Score**: 0.208 (low, suggesting most steps are not critical).
- **Ratio**: 0.281 (possibly the proportion of steps with high importance, but context is unclear).
---
### Key Observations
1. **Question Section**:
- No clear trend; importance scores vary unpredictably.
- Limited to 100 steps, suggesting a focused or initial phase of reasoning.
2. **Thinking Section**:
- High variability in importance scores, with frequent spikes.
- The mean score (0.208) is significantly lower than the peak values, indicating most steps are not critical.
- The ratio (0.281) may imply that ~28% of steps have high importance, but this is speculative without further context.
---
### Interpretation
- **Data Implications**:
- The "Thinking" phase shows that while most reasoning steps are low in importance, there are critical moments (spikes) where importance surges. This could reflect the model's focus on specific insights or decisions.
- The low mean score (0.208) suggests that the majority of reasoning steps are not pivotal, which might indicate inefficiency or redundancy in the process.
- **Relationships**:
- The "Question" section (0–100) appears to be a precursor to the "Thinking" phase, with no direct correlation between the two.
- The red dashed line in the "Thinking" section acts as a benchmark, highlighting the disparity between average and peak importance.
- **Anomalies**:
- The abrupt transition from the "Question" to "Thinking" sections (100 steps) may indicate a shift in reasoning complexity or scope.
- The lack of a clear pattern in the "Question" section contrasts with the structured spikes in the "Thinking" phase, suggesting different cognitive processes.
---
### Notes on Data Extraction
- **Uncertainty**:
- Numerical values (e.g., mean score, ratio) are explicitly labeled but lack units or context for interpretation.
- The y-axis gradient is qualitative, making precise score comparisons difficult.
- **Missing Elements**:
- No explicit legend or colorbar for the y-axis gradient.
- No explanation of the "Ratio" metric (0.281) or its calculation method.
---
### Conclusion
The chart illustrates the dynamic nature of importance scores during reasoning, with the "Thinking" phase dominated by sporadic high-importance steps. The low mean score underscores the prevalence of low-importance steps, raising questions about the efficiency of the reasoning process. Further analysis would require clarification on the metrics and their implications.