# Technical Document Extraction: AI Hallucination and Fact-Checking Diagram
## 1. Overview
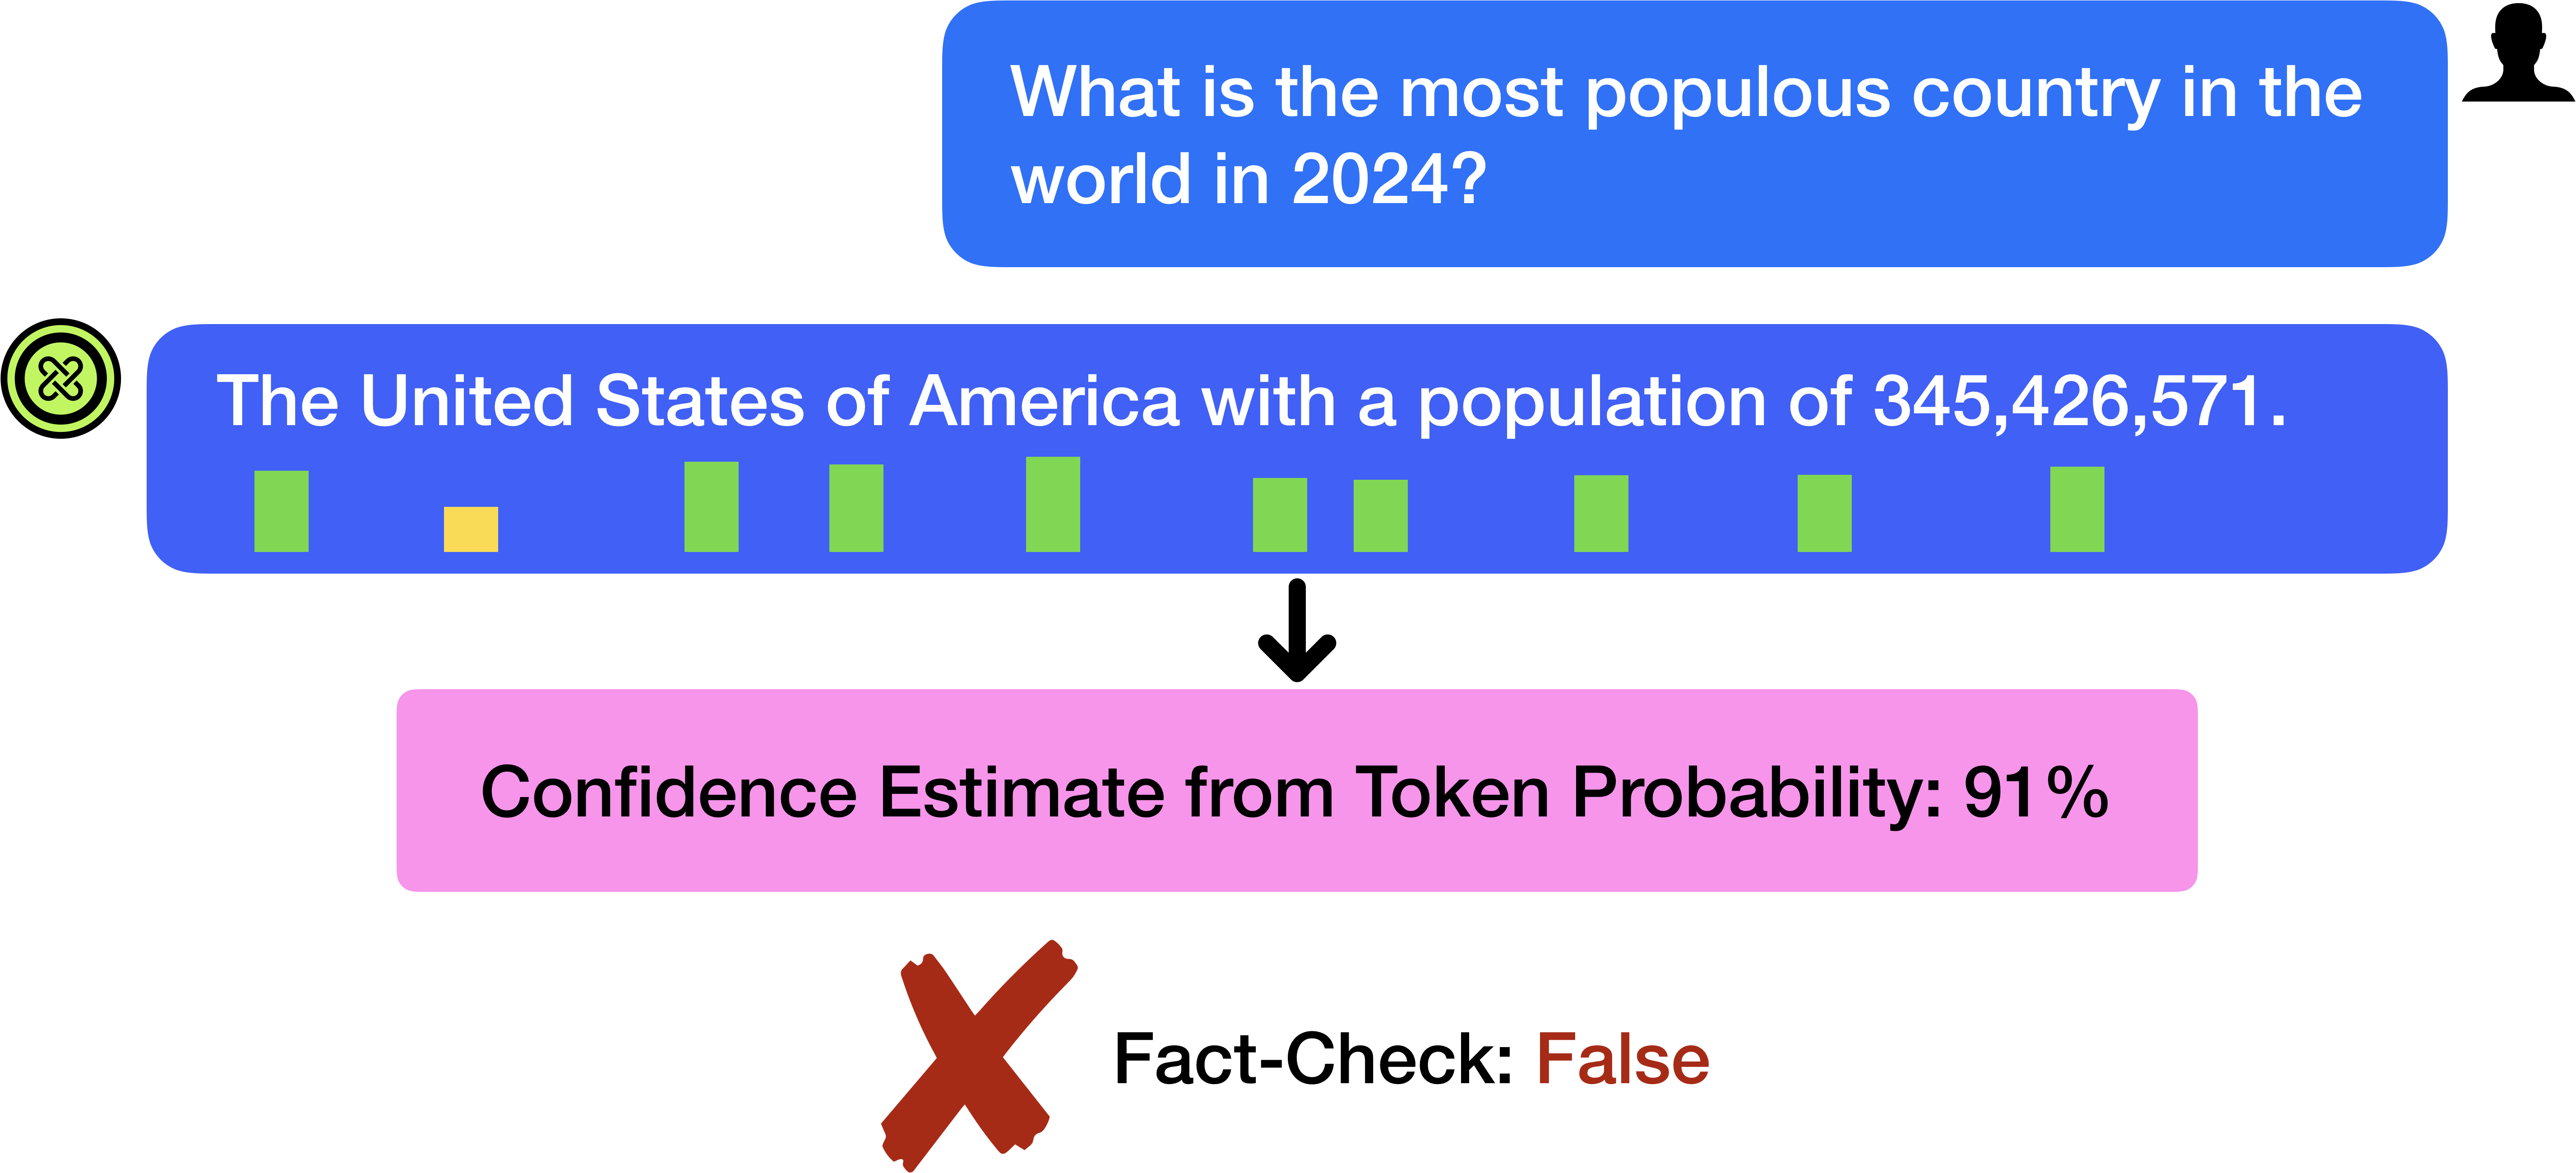
This image is a conceptual diagram illustrating the discrepancy between an AI model's internal confidence (based on token probability) and external factual accuracy. It depicts a conversational interface where an AI provides a factually incorrect answer despite having high statistical confidence.
---
## 2. Component Isolation and Transcription
### Region 1: User Input (Header Right)
* **Visual Element:** A blue speech bubble associated with a black silhouette icon of a person.
* **Text Transcription:** "What is the most populous country in the world in 2024?"
### Region 2: AI Response (Main Body)
* **Visual Element:** A blue speech bubble associated with a green circular logo containing a stylized "X" or knot symbol.
* **Text Transcription:** "The United States of America with a population of 345,426,571."
* **Embedded Data Visualization:** Beneath the text, within the same blue bubble, is a series of colored rectangles representing token-level confidence:
* **Green Rectangles:** 10 units.
* **Yellow Rectangle:** 1 unit (positioned under the word "States").
* **Sequence:** [Green, Yellow, Green, Green, Green, Green, Green, Green, Green, Green].
* **Trend:** The visualization shows that almost all tokens in the generated sentence have high probability (Green), with only one token showing moderate/lower probability (Yellow).
### Region 3: Confidence Metric (Center)
* **Visual Element:** A pink rectangular box connected to the AI response by a downward-pointing black arrow.
* **Text Transcription:** "Confidence Estimate from Token Probability: 91%"
* **Analysis:** This represents the aggregate statistical confidence the model has in its generated string.
### Region 4: Fact-Check Result (Footer)
* **Visual Element:** A large red "X" mark.
* **Text Transcription:** "Fact-Check: False"
* **Color Coding:** The word "False" is highlighted in a dark red/brown color to match the "X" mark.
---
## 3. Technical Flow and Logic Analysis
1. **Query:** The user asks a factual question regarding global population.
2. **Generation:** The AI generates a specific answer.
3. **Internal Metric:** The system calculates a **91% confidence score** based on the mathematical probability of the tokens selected during generation. The visual markers show that the model "believes" its output is highly likely to be correct.
4. **External Verification:** Despite the high internal confidence (91%), the statement is objectively incorrect (as India and China have significantly larger populations than the USA).
5. **Conclusion:** The diagram serves as a technical warning that high token probability/confidence estimates do not guarantee factual truth, illustrating the phenomenon of "confident hallucination."
---
## 4. Data Summary Table
| Category | Value / Content |
| :--- | :--- |
| **User Query** | What is the most populous country in the world in 2024? |
| **AI Output** | The United States of America with a population of 345,426,571. |
| **Token Probability Visual** | 9 Green blocks, 1 Yellow block |
| **Aggregate Confidence** | 91% |
| **Factual Status** | False |