## Diagram: AI Response Fact-Check Visualization
### Overview
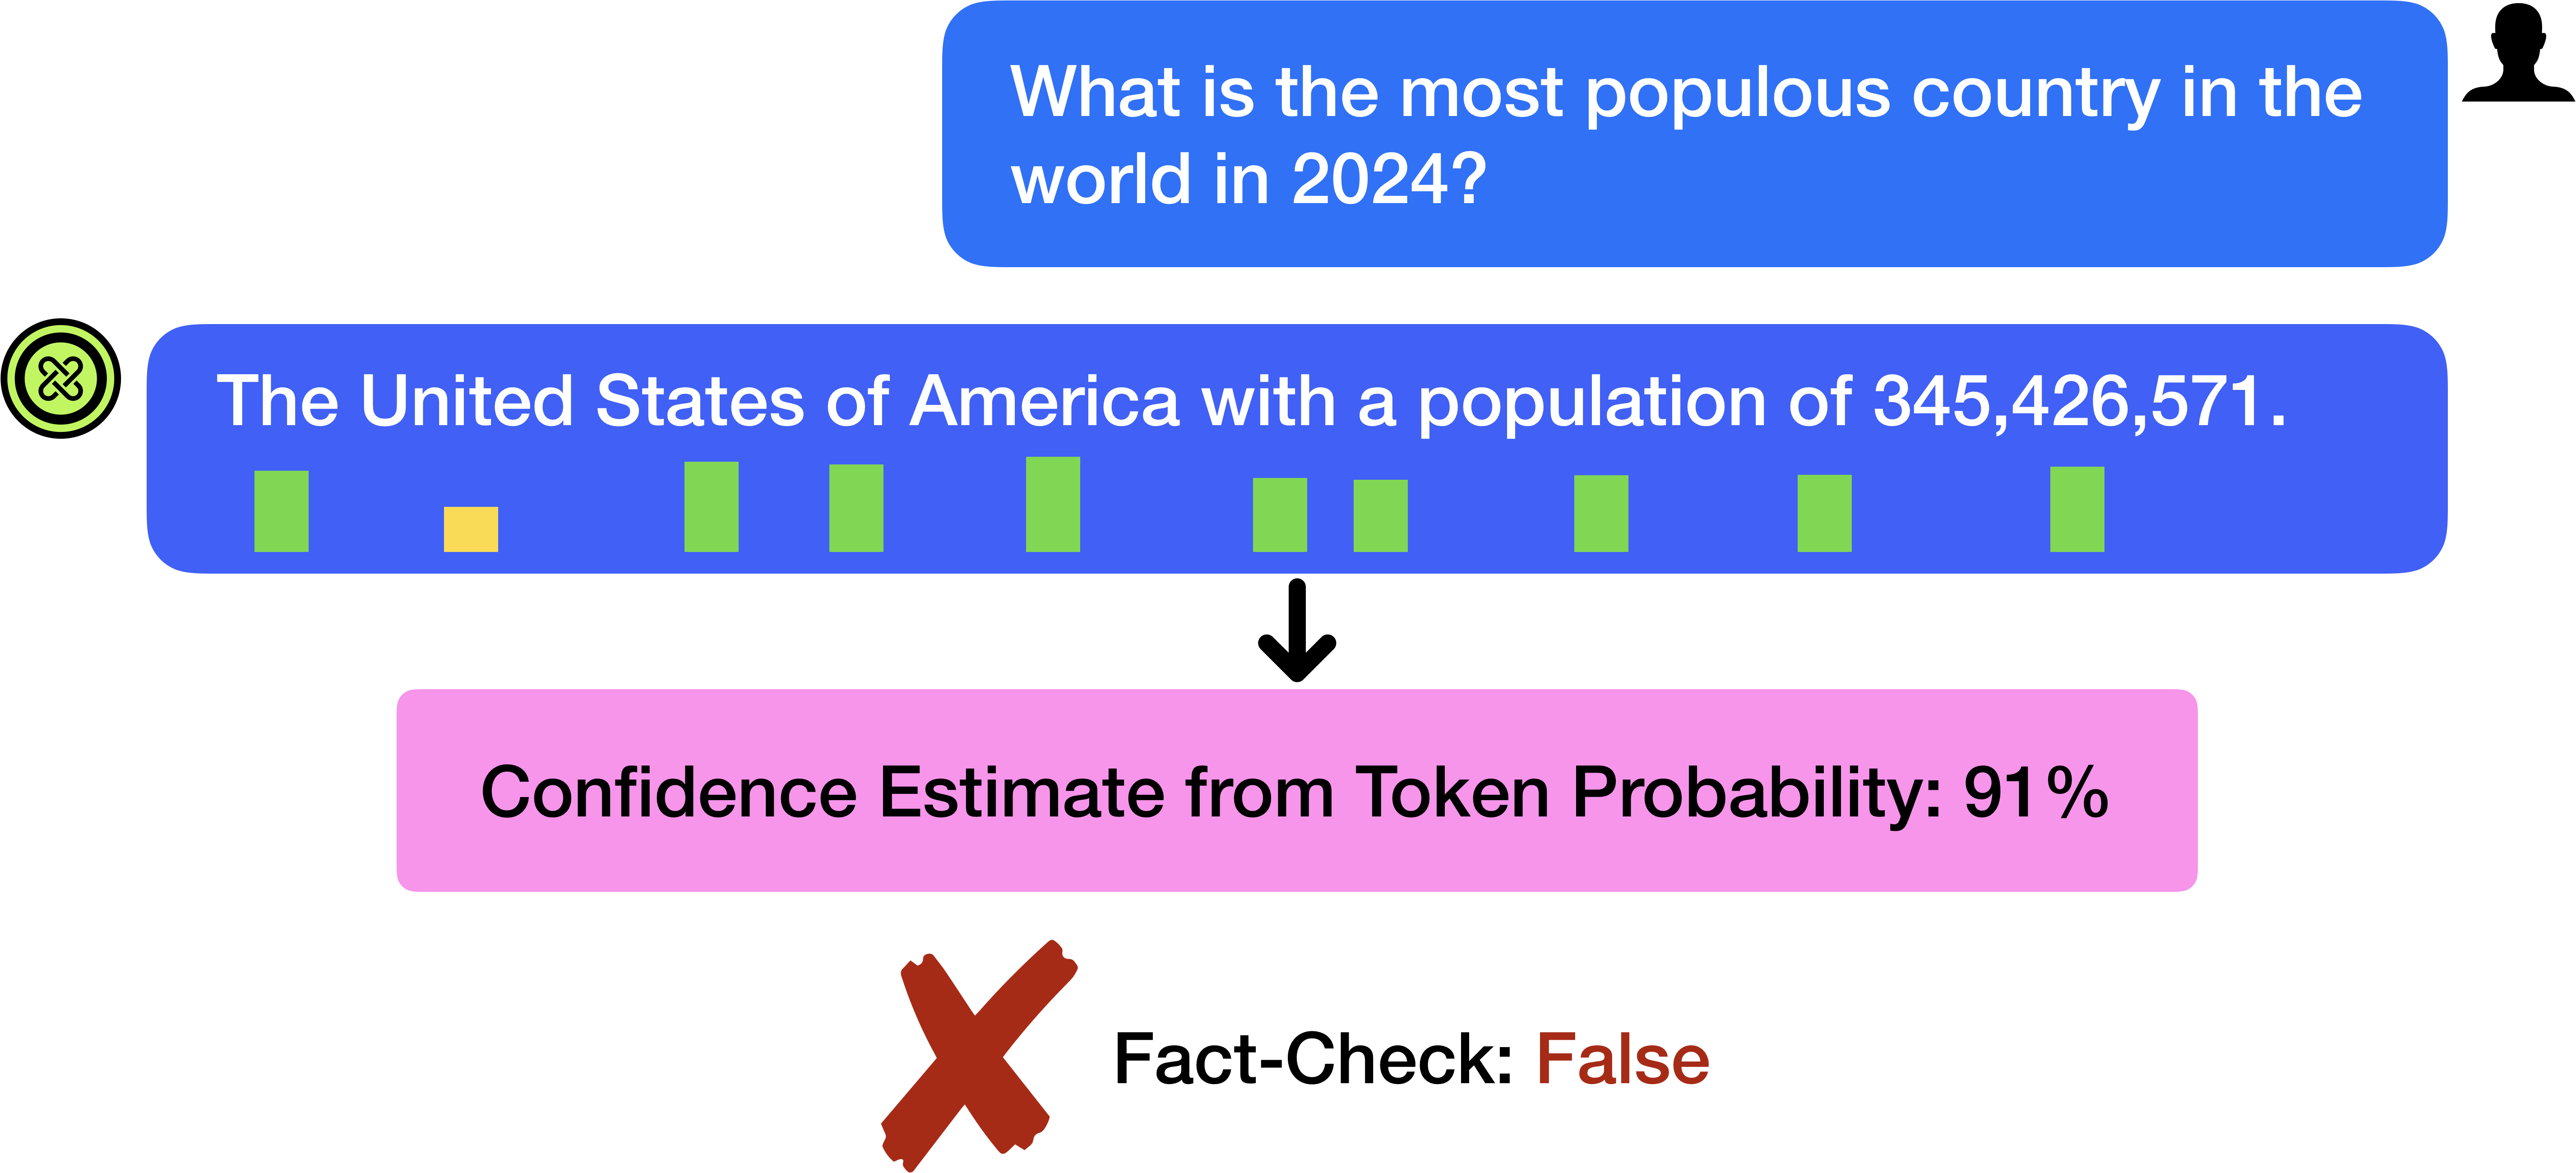
The image is a diagram illustrating a conversational AI interaction where a user's question receives a factually incorrect response, despite a high internal confidence estimate. It visually breaks down the query, the AI's generated answer, a confidence metric derived from token probabilities, and a final fact-check verdict.
### Components/Axes
The diagram is structured vertically with distinct, labeled components:
1. **User Query (Top, Blue Bubble):**
* **Text:** "What is the most populous country in the world in 2024?"
* **Position:** Top-right of the image, aligned with a user silhouette icon.
* **Style:** White text on a blue, rounded rectangular background.
2. **AI Response (Middle, Blue Bubble):**
* **Text:** "The United States of America with a population of 345,426,571."
* **Position:** Centered below the user query, aligned with a green circular AI icon on the left.
* **Style:** White text on a blue, rounded rectangular background.
* **Embedded Data Visualization:** Below the text, a series of 11 vertical bars represent token-level confidence.
* **Colors & Placement (from left to right):**
| Bar | Color | Height |
|-----|-------|--------|
| 1 | Green | Tall |
| 2 | Yellow| Short |
| 3 | Green | Tall |
| 4 | Green | Tall |
| 5 | Green | Tall |
| 6 | Green | Medium |
| 7 | Green | Medium |
| 8 | Green | Medium |
| 9 | Green | Medium |
| 10 | Green | Medium |
| 11 | Green | Medium |
* **Legend/Interpretation:** The green bars indicate high confidence for most tokens in the response. The single yellow bar (second from left) indicates a token with notably lower confidence.
3. **Confidence Estimate (Lower Middle, Pink Box):**
* **Text:** "Confidence Estimate from Token Probability: 91%"
* **Position:** Centered below the AI response bubble, connected by a downward-pointing black arrow.
* **Style:** Black text on a pink, rounded rectangular background.
4. **Fact-Check Verdict (Bottom):**
* **Text:** "Fact-Check: **False**"
* **Position:** Bottom-center of the image.
* **Style:** Black text with the word "False" in red, preceded by a large, red "X" icon.
### Detailed Analysis
* **Textual Content:** All text is in English. The core factual claim made by the AI is that the United States was the most populous country in 2024 with a population of 345,426,571.
* **Confidence Visualization:** The token probability bars show that the AI generated most of its response with high confidence (green). The single low-confidence token (yellow) likely corresponds to a specific word or number in the sentence where the model was less certain.
* **Numerical Data:** The only specific data point provided is the population figure: 345,426,571. The confidence estimate is a single aggregate value: 91%.
### Key Observations
1. **High Confidence, Low Accuracy:** The most striking observation is the disconnect between the AI's high internal confidence (91% and mostly green bars) and the factually incorrect output, as confirmed by the "False" verdict.
2. **Specific Error:** The claim is factually wrong. As of 2024, India had surpassed China as the world's most populous country. The provided population figure for the U.S. is also an overestimate.
3. **Visual Flow:** The diagram uses a clear top-down flow (Query -> Response -> Confidence -> Verdict) to tell a story about AI reliability.
4. **Color Coding:** Colors are used semantically: blue for dialogue, green for high confidence, yellow for lower confidence, pink for a derived metric, and red for an error/failure state.
### Interpretation
This diagram serves as a critical case study on the limitations of large language models (LLMs) and the pitfalls of relying solely on their output. It demonstrates that:
* **Confidence ≠ Correctness:** A model can be highly confident in its generated text based on its training data and probability distributions, yet that text can still be factually erroneous. The 91% confidence score is a measure of the model's internal certainty in its word choices, not a measure of real-world truth.
* **The Need for Verification:** The final "Fact-Check: False" stamp underscores the essential role of external verification systems or human oversight when using AI for factual queries. The model's internal confidence metric is insufficient as a sole guarantor of accuracy.
* **Token-Level Insight:** The embedded bar chart provides a more granular view than the aggregate 91% score. It shows that uncertainty is not evenly distributed; the model was less sure about one specific part of its answer (the yellow bar), which could be a clue for where the error might lie (e.g., the specific population number or the country name).
In essence, the image is a visual argument for caution, highlighting that even advanced AI systems can confidently present misinformation, making critical thinking and fact-checking indispensable.