## Line Chart: Vicuna-7B-v1.5-Chat Training Loss
### Overview
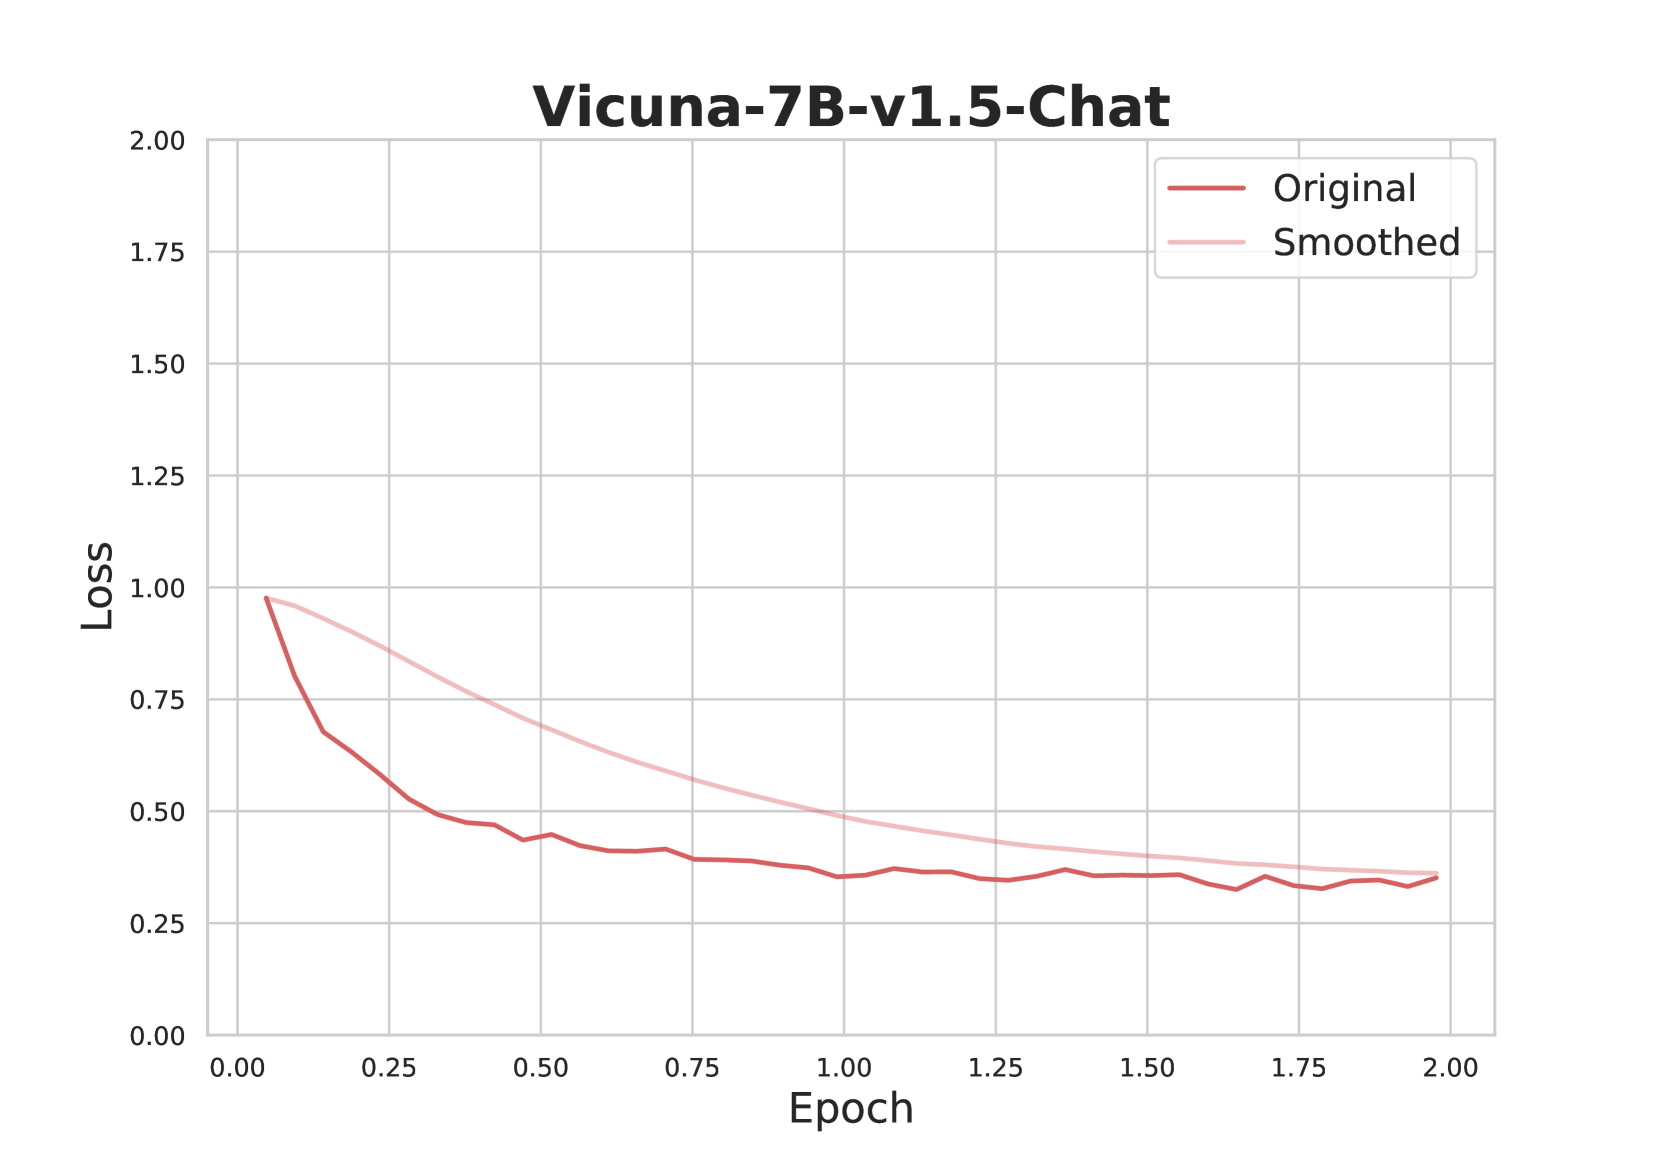
The chart visualizes the training loss of the Vicuna-7B-v1.5-Chat model across 2.0 epochs. Two lines are plotted: "Original" (red) and "Smoothed" (light red), showing loss reduction over time. Both lines converge toward lower loss values, indicating model stabilization.
### Components/Axes
- **X-axis (Epoch)**: Labeled "Epoch," with markers at 0.00, 0.25, 0.50, 0.75, 1.00, 1.25, 1.50, 1.75, and 2.00.
- **Y-axis (Loss)**: Labeled "Loss," with markers at 0.00, 0.25, 0.50, 0.75, 1.00, 1.25, 1.50, 1.75, and 2.00.
- **Legend**: Located in the top-right corner, associating:
- Red line with "Original"
- Light red line with "Smoothed"
### Detailed Analysis
1. **Original Line (Red)**:
- Starts at **~1.0 loss** at epoch 0.00.
- Declines sharply to **~0.4 loss** by epoch 0.50.
- Plateaus between **~0.3–0.4 loss** from epoch 0.75 to 2.00, with minor fluctuations (e.g., ~0.32 at epoch 1.75).
2. **Smoothed Line (Light Red)**:
- Begins at **~0.95 loss** at epoch 0.00.
- Follows a smoother decline to **~0.35 loss** by epoch 2.00.
- Exhibits less variance than the Original line, with a consistent downward trend.
### Key Observations
- Both lines show a **monotonic decrease** in loss, confirming model improvement over epochs.
- The Smoothed line reduces noise in the Original line’s trajectory, highlighting a clearer trend.
- Convergence near epoch 2.00 suggests diminishing returns in training efficiency.
### Interpretation
The data demonstrates effective model training, with loss reduction indicating improved performance. The Smoothed line’s role in filtering noise emphasizes the importance of trend analysis in large-scale training. The convergence of both lines toward lower loss values implies that the model stabilizes after ~1.5 epochs, with minimal further gains expected beyond this point. This aligns with typical training dynamics where early epochs drive significant improvement, followed by stabilization.