## Line Chart: Vicuna-7B-v1.5-Chat Loss vs. Epoch
### Overview
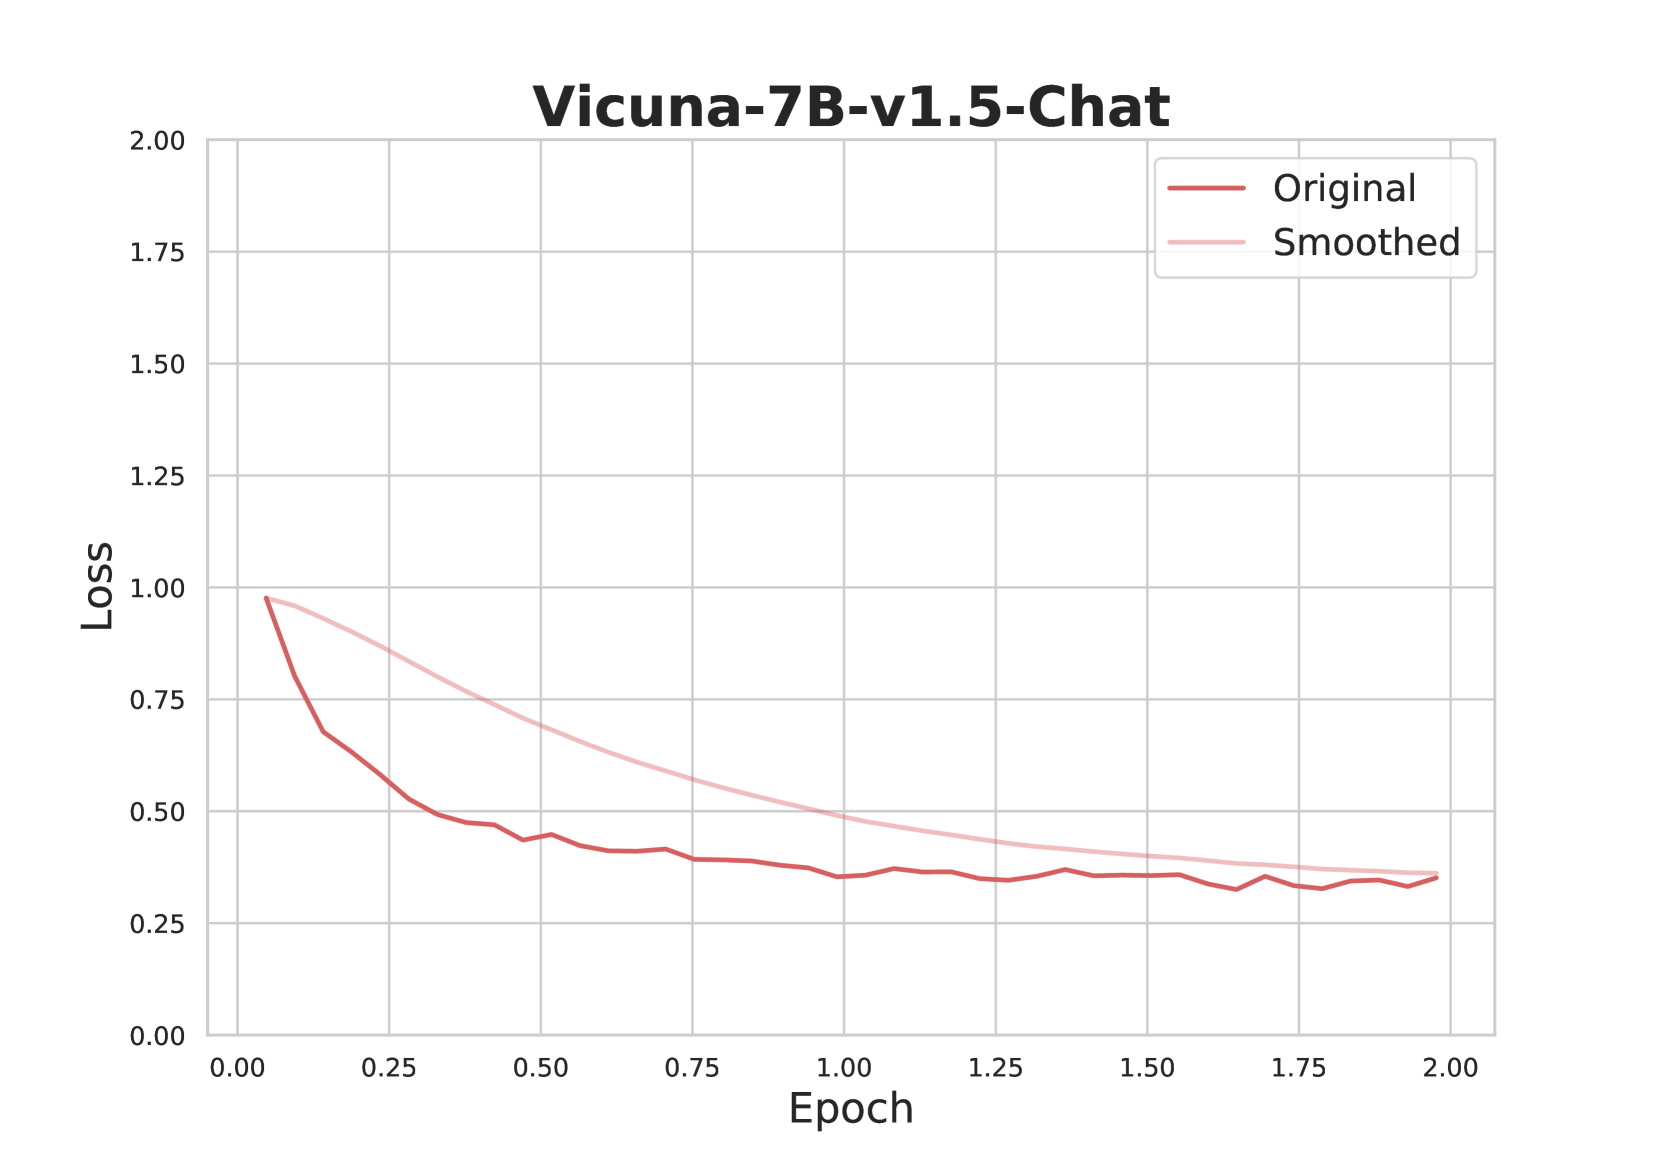
The image is a line chart displaying the loss of the Vicuna-7B-v1.5-Chat model during training, plotted against the number of epochs. Two lines are shown: the "Original" loss and the "Smoothed" loss. The chart illustrates how the loss decreases over time, indicating the model's learning progress.
### Components/Axes
* **Title:** Vicuna-7B-v1.5-Chat
* **X-axis:** Epoch, with markers at 0.00, 0.25, 0.50, 0.75, 1.00, 1.25, 1.50, 1.75, and 2.00.
* **Y-axis:** Loss, with markers at 0.00, 0.25, 0.50, 0.75, 1.00, 1.25, 1.50, 1.75, and 2.00.
* **Legend:** Located in the top-right corner.
* "Original" - Represented by a dark red line.
* "Smoothed" - Represented by a light pink line.
### Detailed Analysis
* **Original Loss (Dark Red Line):**
* Trend: The original loss decreases rapidly in the initial epochs and then plateaus.
* Data Points:
* Epoch 0.00: Loss ≈ 1.00
* Epoch 0.25: Loss ≈ 0.65
* Epoch 0.50: Loss ≈ 0.48
* Epoch 0.75: Loss ≈ 0.42
* Epoch 1.00: Loss ≈ 0.40
* Epoch 1.25: Loss ≈ 0.35
* Epoch 1.50: Loss ≈ 0.35
* Epoch 1.75: Loss ≈ 0.33
* Epoch 2.00: Loss ≈ 0.35
* **Smoothed Loss (Light Pink Line):**
* Trend: The smoothed loss decreases more gradually than the original loss.
* Data Points:
* Epoch 0.00: Loss ≈ 1.00
* Epoch 0.25: Loss ≈ 0.85
* Epoch 0.50: Loss ≈ 0.75
* Epoch 0.75: Loss ≈ 0.65
* Epoch 1.00: Loss ≈ 0.55
* Epoch 1.25: Loss ≈ 0.48
* Epoch 1.50: Loss ≈ 0.42
* Epoch 1.75: Loss ≈ 0.39
* Epoch 2.00: Loss ≈ 0.37
### Key Observations
* The "Original" loss fluctuates more than the "Smoothed" loss, which is expected due to the smoothing effect.
* Both lines converge to a similar loss value at the end of the training (around Epoch 2.00).
* The most significant decrease in loss occurs within the first 0.5 epochs.
### Interpretation
The chart demonstrates the training progress of the Vicuna-7B-v1.5-Chat model. The decreasing loss indicates that the model is learning and improving its performance over time. The "Smoothed" loss provides a clearer view of the overall trend by reducing the noise present in the "Original" loss. The convergence of both lines suggests that the model has reached a stable state, where further training may not significantly reduce the loss. The rapid initial decrease in loss highlights the importance of the early training stages.