\n
## Line Chart: Vicuna-7B-v1.5-Chat Loss vs. Epoch
### Overview
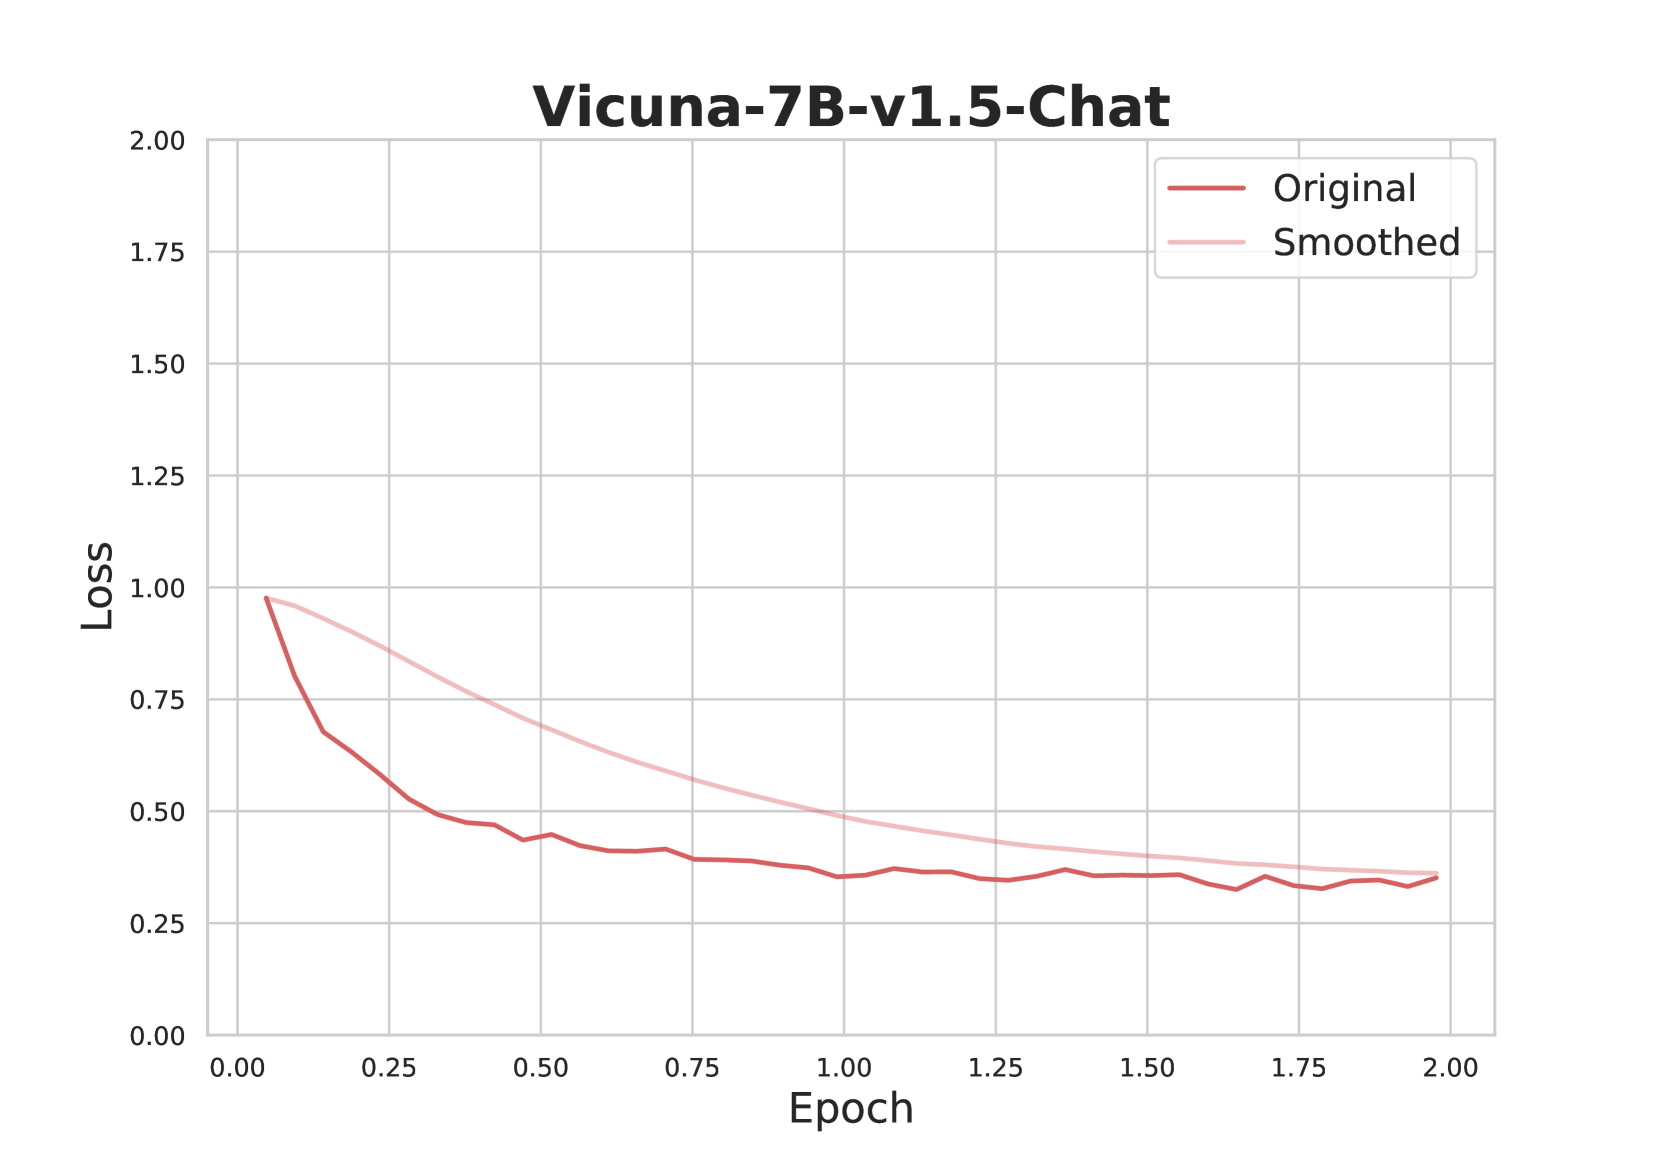
This chart displays the loss function of a model (Vicuna-7B-v1.5-Chat) over epochs during training. Two lines are plotted: the original loss and a smoothed version of the loss. The chart aims to visualize the training process and how the loss changes with each epoch.
### Components/Axes
* **Title:** Vicuna-7B-v1.5-Chat
* **X-axis:** Epoch (ranging from approximately 0.00 to 2.00)
* **Y-axis:** Loss (ranging from approximately 0.00 to 2.00)
* **Legend:**
* Original (represented by a dark red line)
* Smoothed (represented by a light red line)
* **Grid:** A light gray grid is present to aid in reading values.
### Detailed Analysis
The chart shows two lines representing the loss over epochs.
**Original Loss (Dark Red Line):**
The line starts at approximately 0.98 at Epoch 0.00. It then exhibits a steep downward trend until approximately Epoch 0.25, reaching a value of around 0.40. From Epoch 0.25 to Epoch 0.75, the line continues to decrease, but at a slower rate, reaching a minimum of approximately 0.35 at Epoch 0.65. After Epoch 0.75, the line fluctuates between approximately 0.30 and 0.45, showing some oscillation but generally remaining relatively stable. At Epoch 2.00, the value is approximately 0.32.
**Smoothed Loss (Light Red Line):**
The smoothed line starts at approximately 0.98 at Epoch 0.00, mirroring the original line. It also shows a downward trend, but it is less steep and more consistent than the original line. The smoothed line reaches a value of approximately 0.50 at Epoch 0.25. It continues to decrease, reaching a minimum of approximately 0.38 at Epoch 0.75. From Epoch 0.75 to Epoch 2.00, the smoothed line remains relatively stable, fluctuating between approximately 0.35 and 0.40. At Epoch 2.00, the value is approximately 0.37.
### Key Observations
* Both the original and smoothed loss curves demonstrate a decreasing trend, indicating that the model is learning and improving over epochs.
* The smoothed line is less noisy and provides a clearer representation of the overall trend.
* The original loss curve exhibits more fluctuations, suggesting that the training process is not perfectly smooth.
* The loss appears to converge after approximately 1.0 epoch, as the lines become relatively stable.
* The difference between the original and smoothed loss is minimal after Epoch 1.0.
### Interpretation
The chart suggests that the Vicuna-7B-v1.5-Chat model is successfully being trained, as the loss function is decreasing over time. The smoothing of the loss curve helps to visualize the underlying trend and reduce the impact of noise. The convergence of the loss after approximately 1.0 epoch indicates that the model is approaching a stable state. The fluctuations in the original loss curve could be due to various factors, such as the stochastic nature of the training process or the complexity of the dataset. The relatively small difference between the original and smoothed loss curves suggests that the smoothing process is not significantly altering the overall trend. This data is useful for monitoring the training process, identifying potential issues (e.g., overfitting or underfitting), and determining when to stop training.