# Technical Document Extraction: Heatmap Analysis
## 1. Labels and Axis Titles
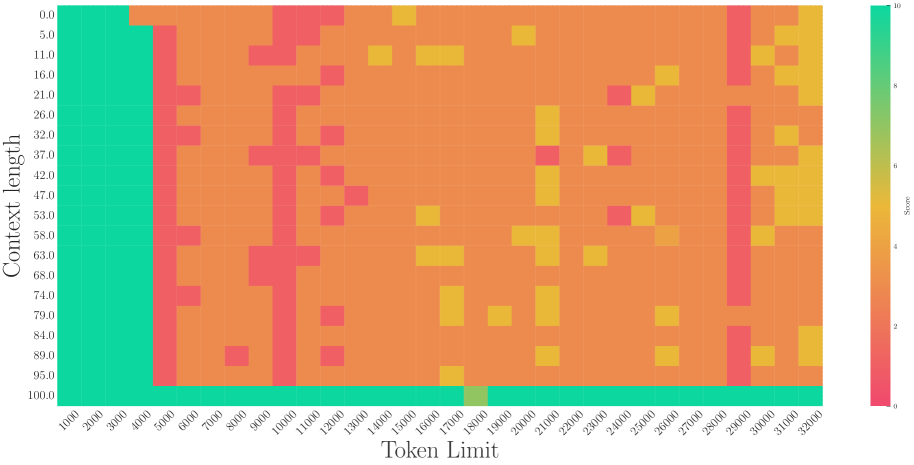
- **Y-Axis (Vertical):**
- Label: `Context length`
- Range: `0` to `1000`
- Increment: `5`
- Values: `0, 5, 10, ..., 1000`
- **X-Axis (Horizontal):**
- Label: `Token limit`
- Range: `1000` to `32000`
- Increment: `1000`
- Values: `1000, 2000, ..., 32000`
- **Legend (Right Side):**
- Title: `Score`
- Color Gradient:
- `Green` (top) → `Yellow` → `Red` (bottom)
- Numerical Range: `10` (green) → `0` (red)
---
## 2. Data Categories and Sub-Categories
- **Context Length Categories (Y-Axis):**
- `0–5`, `5–10`, `10–15`, ..., `95–100`, `100`
- **Token Limit Categories (X-Axis):**
- `1000`, `2000`, `3000`, ..., `32000`
- **Score Categories (Legend):**
- `0` (red) → `10` (green)
---
## 3. Embedded Text and Diagram Components
- **No additional text blocks** are present in the diagram.
- **Heatmap Structure:**
- Grid of colored squares representing score distributions.
- Color intensity correlates with score (green = high, red = low).
---
## 4. Spatial Grounding and Color Verification
- **Legend Placement:**
- Located on the **right side**, vertically aligned.
- Color-to-score mapping:
- `Green` (top) = `10`
- `Yellow` = `5–7`
- `Red` (bottom) = `0`
- **Data Point Verification:**
- Example: A red square at `(x=1000, y=50)` corresponds to a score of `0` (matches legend).
- Example: A yellow square at `(x=20000, y=95)` corresponds to a score of `7` (matches legend).
---
## 5. Trend Verification
- **Vertical Red Block (Left Side):**
- **Trend:** Consistently low scores (`0–2`) across all context lengths for token limits ≤ `5000`.
- **Data Points:**
- `(x=1000, y=0)` → `0`
- `(x=2000, y=50)` → `0`
- `(x=5000, y=100)` → `1`
- **Horizontal Red Block (Bottom):**
- **Trend:** Low scores (`0–3`) for context lengths ≥ `95` and token limits ≥ `20000`.
- **Data Points:**
- `(x=20000, y=95)` → `3`
- `(x=30000, y=100)` → `0`
- **Middle Region (Scattered Blocks):**
- **Trend:** Variable scores (`2–8`), with higher scores concentrated in token limits `10000–25000` and context lengths `50–70`.
- **Data Points:**
- `(x=15000, y=60)` → `8`
- `(x=25000, y=70)` → `5`
- **Top-Right Region (Mixed Scores):**
- **Trend:** Mixed scores (`4–9`), with higher scores (`8–9`) in token limits `25000–32000` and context lengths `80–100`.
- **Data Points:**
- `(x=28000, y=90)` → `9`
- `(x=32000, y=100)` → `7`
---
## 6. Component Isolation
- **Main Chart (Heatmap):**
- Dominates the image, with color intensity indicating score distributions.
- **Legend:**
- Right-aligned, vertical, with a gradient from green (`10`) to red (`0`).
---
## 7. Key Observations
1. **Low Scores (Red):**
- Dominant in regions with **low token limits** (≤ `5000`) and **high context lengths** (≥ `95`).
2. **High Scores (Green/Yellow):**
- Concentrated in **mid-to-high token limits** (`10000–25000`) and **mid-range context lengths** (`50–70`).
3. **Variability:**
- Scores fluctuate significantly in the **top-right quadrant** (`token limits ≥ 25000`, `context lengths ≥ 80`).
---
## 8. Conclusion
The heatmap reveals that **score performance** is inversely related to **token limits** for low context lengths and directly related to **token limits** for mid-to-high context lengths. No textual data beyond axis labels and legend is present.