\n
## Diagram: Neural Network and Gated Recurrent Unit (GRU)
### Overview
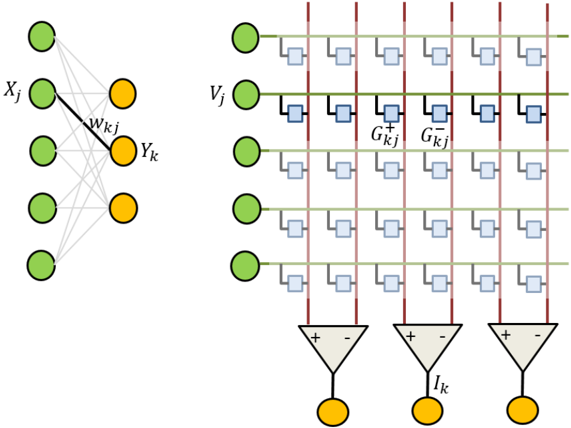
The image depicts a simplified illustration of a neural network connection on the left, and a Gated Recurrent Unit (GRU) architecture on the right. The neural network shows connections between input nodes (green) and output nodes (orange) with labeled weights. The GRU diagram illustrates the flow of information through gates and the computation of output.
### Components/Axes
The diagram consists of the following components:
* **Input Layer (Left):** Green circles labeled *Xj*.
* **Output Layer (Left):** Orange circles labeled *Yk*.
* **Weight (Left):** Labeled *wk j* connecting input and output nodes.
* **Input Vector (Right):** Green circles labeled *Vj*.
* **Gates (Right):** Represented by square boxes with red lines indicating input and green lines indicating output.
* **Gate Weights (Right):** Labeled *Gkj-* and *Gkj+*.
* **Summation Node (Right):** Triangle-shaped nodes with "+" and "-" signs, indicating summation and subtraction.
* **Output (Right):** Orange circles labeled *Ik*.
### Detailed Analysis or Content Details
**Neural Network (Left):**
The neural network shows a connection between an input layer with multiple nodes (Xj) and an output layer with multiple nodes (Yk). Each connection is labeled with a weight (wk j). The diagram does not provide specific numerical values for the weights or the number of nodes.
**Gated Recurrent Unit (GRU) (Right):**
The GRU diagram shows a series of horizontal lines representing the flow of information.
* There are 5 input nodes (Vj) connected to a series of gate blocks.
* Each gate block consists of multiple square boxes.
* Red vertical lines connect the input nodes to the gate blocks.
* Green horizontal lines connect the gate blocks to each other and to the summation nodes.
* There are three summation nodes, each with a "+" and "-" sign.
* Each summation node connects to an output node (Ik).
* The gate weights are labeled *Gkj-* and *Gkj+*. The diagram does not provide specific numerical values for these weights.
* The diagram does not provide the number of gate blocks within each GRU cell.
### Key Observations
* The GRU diagram illustrates the core components of a GRU cell, including the input gate, reset gate, and update gate (though these are not explicitly labeled).
* The summation nodes suggest a weighted combination of inputs.
* The diagram is a simplified representation and does not show all the details of a GRU cell, such as the activation functions.
* The diagram does not provide any numerical data or values.
### Interpretation
The diagram illustrates the fundamental architecture of a neural network and a GRU cell. The neural network portion demonstrates the basic connection between input and output layers, while the GRU portion shows how information is processed and controlled through gates. The GRU is a type of recurrent neural network designed to handle sequential data by selectively remembering or forgetting information. The gates (represented by the square boxes) control the flow of information, allowing the GRU to learn long-term dependencies in the data. The diagram highlights the key components of a GRU cell, but it is a simplified representation and does not include all the details of a fully implemented GRU. The absence of numerical values suggests that the diagram is intended to convey the conceptual structure rather than specific calculations. The diagram is a visual aid for understanding the flow of information within these neural network architectures.