\n
## Line Chart: HMC Step vs. Value for Uninformative and Informative HMC
### Overview
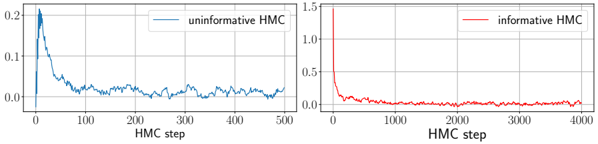
The image presents two line charts side-by-side, comparing the behavior of "uninformative HMC" and "informative HMC" over "HMC step". Both charts depict a value (likely an error or loss) decreasing with increasing HMC steps, eventually stabilizing around zero.
### Components/Axes
* **X-axis (Both Charts):** "HMC step", ranging from 0 to 500 for the left chart and 0 to 4000 for the right chart. The scale is linear.
* **Y-axis (Both Charts):** Value, ranging from 0 to 0.25 for the left chart and 0 to 1.5 for the right chart. The scale is linear.
* **Left Chart:**
* **Line:** Blue, labeled "uninformative HMC" in the top-left corner.
* **Right Chart:**
* **Line:** Red, labeled "informative HMC" in the top-right corner.
* **Grid:** Both charts have a light gray grid for easier value reading.
### Detailed Analysis
**Left Chart: Uninformative HMC**
The blue line representing "uninformative HMC" starts at approximately 0.23 at HMC step 0. It rapidly decreases to around 0.05 by HMC step 50. From step 50 to 500, the line fluctuates around a mean value of approximately 0.02, with variations between roughly 0.005 and 0.04. The trend is a rapid initial decrease followed by a relatively stable, noisy plateau.
**Right Chart: Informative HMC**
The red line representing "informative HMC" begins at approximately 1.4 at HMC step 0. It exhibits a steep decline to around 0.5 by HMC step 500. The line continues to decrease, reaching approximately 0.1 by HMC step 2000. From step 2000 to 4000, the line stabilizes around a mean value of approximately 0.02, with fluctuations between roughly 0.01 and 0.03. The trend is a more gradual but sustained decrease, eventually reaching a similar stable plateau as the uninformative HMC.
### Key Observations
* The "informative HMC" starts with a significantly higher value than the "uninformative HMC".
* The "informative HMC" takes considerably more steps to reach a stable plateau compared to the "uninformative HMC".
* Both methods eventually converge to a similar stable value around 0.02.
* The "uninformative HMC" exhibits more pronounced fluctuations around its stable value.
### Interpretation
The charts demonstrate the convergence behavior of two different Hamiltonian Monte Carlo (HMC) methods. The "informative HMC" likely utilizes more information (e.g., gradient information) to guide the sampling process, resulting in a slower initial decrease but potentially better long-term stability. The "uninformative HMC" converges more quickly initially, but exhibits more noise and potentially less accurate sampling in the long run. The fact that both methods eventually converge to a similar value suggests that both are ultimately capable of finding a good solution, but their paths to convergence differ significantly. The higher initial value for the informative HMC could indicate a larger initial error or a more complex energy landscape. The fluctuations in both charts after convergence suggest that the sampling process is still not perfectly stable and may require further refinement.