## Line Graphs: Uninformative vs. Informative HMC Performance
### Overview
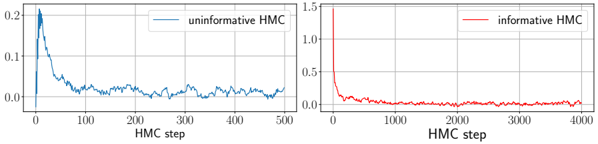
The image contains two side-by-side line graphs comparing the performance of "uninformative HMC" (blue) and "informative HMC" (red) across HMC steps. Both graphs show rapid initial changes followed by stabilization, with distinct y-axis scales.
### Components/Axes
- **X-axis**: Labeled "HMC step" for both graphs, ranging from 0 to 500 (left) and 0 to 4000 (right).
- **Y-axis (Left)**: Unlabeled, scaled from 0.0 to 0.2.
- **Y-axis (Right)**: Unlabeled, scaled from 0.0 to 1.5.
- **Legends**:
- Top-right of left graph: "uninformative HMC" (blue line).
- Top-right of right graph: "informative HMC" (red line).
- **Gridlines**: Present in both graphs for reference.
### Detailed Analysis
#### Left Graph (Uninformative HMC)
- **Initial Peak**: Starts at ~0.2 at step 0, dropping sharply to ~0.05 by step 50.
- **Stabilization**: Fluctuates between ~0.03 and ~0.07 from step 100 to 500.
- **Trend**: Gradual decay with minor oscillations after the initial drop.
#### Right Graph (Informative HMC)
- **Initial Drop**: Starts at ~1.5 at step 0, plunging to ~0.01 by step 100.
- **Stabilization**: Remains near 0.01 with minor noise (0.005–0.015) from step 1000 to 4000.
- **Trend**: Near-zero values after step 100, indicating sustained low activity.
### Key Observations
1. **Divergent Initial Behavior**:
- Uninformative HMC begins at a moderate value (~0.2) and decays slowly.
- Informative HMC starts at a much higher value (~1.5) but collapses rapidly.
2. **Long-Term Stability**:
- Uninformative HMC stabilizes at ~0.05 after step 50.
- Informative HMC stabilizes near 0.01 after step 1000.
3. **Scale Differences**:
- The right graph’s y-axis spans 1.5× the left graph’s range, emphasizing the magnitude difference in initial values.
### Interpretation
The graphs suggest that "informative HMC" achieves significantly faster and more decisive convergence compared to "uninformative HMC." The red line’s rapid drop to near-zero values implies that informative HMC may be more efficient at reducing uncertainty or optimizing a target metric. In contrast, the blue line’s slower decay and higher baseline values indicate that uninformative HMC struggles to stabilize, potentially due to weaker prior information or higher computational costs. The stark difference in y-axis scales highlights the need for context-specific interpretation—what constitutes "high" or "low" depends on the underlying problem being modeled.