\n
## Diagram: Phylogenetic Tree Representation
### Overview
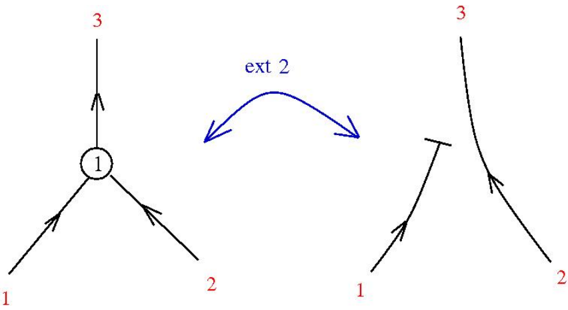
The image depicts a diagram resembling a phylogenetic tree, illustrating a branching evolutionary relationship. It shows two tree structures connected by an arc labeled "ext 2". Each branch is labeled with a numerical value, likely representing a species or group.
### Components/Axes
The diagram consists of:
* **Nodes:** Represented by circles and branch endpoints.
* **Branches:** Lines connecting the nodes, indicating evolutionary relationships.
* **Labels:** Numerical values (1, 2, 3) associated with each branch endpoint.
* **Arc:** A curved arrow labeled "ext 2" connecting the two tree structures.
There are no explicit axes in this diagram.
### Detailed Analysis or Content Details
The diagram can be divided into two main tree structures.
**Left Tree:**
* A central node labeled "1" is the root of the tree.
* Three branches originate from this central node.
* The top branch is labeled "3".
* The bottom-left branch is labeled "1".
* The bottom-right branch is labeled "2".
**Right Tree:**
* A branch originates from an implied root.
* The top branch is labeled "3".
* The bottom-left branch is labeled "1".
* The bottom-right branch is labeled "2".
The arc labeled "ext 2" originates near the central node "1" of the left tree and points towards the implied root of the right tree.
### Key Observations
* Both trees share the same branch labels (1, 2, 3), suggesting a common ancestry or a relationship between the groups represented.
* The arc "ext 2" implies an extinction event or a significant evolutionary divergence.
* The trees are not identical in structure, indicating that the evolutionary paths diverged after the event represented by "ext 2".
### Interpretation
The diagram likely represents the evolutionary history of a group of organisms. The central node "1" could represent a common ancestor. The branching pattern shows how this ancestor gave rise to different lineages, labeled 1, 2, and 3. The arc labeled "ext 2" suggests that one lineage experienced an extinction event or a major evolutionary shift, leading to the divergence of the two trees. The fact that the same labels (1, 2, 3) appear in both trees suggests that the surviving lineages retained some characteristics of the original ancestor.
The diagram is a simplified representation of a complex evolutionary process. It does not provide information about the time scale or the specific characteristics of the organisms involved. However, it effectively illustrates the concept of common ancestry and evolutionary divergence. The "ext 2" label is crucial, indicating a significant event that shaped the evolutionary trajectory of the group.