# Technical Document Analysis of Line Graph
## 1. **Axis Labels and Titles**
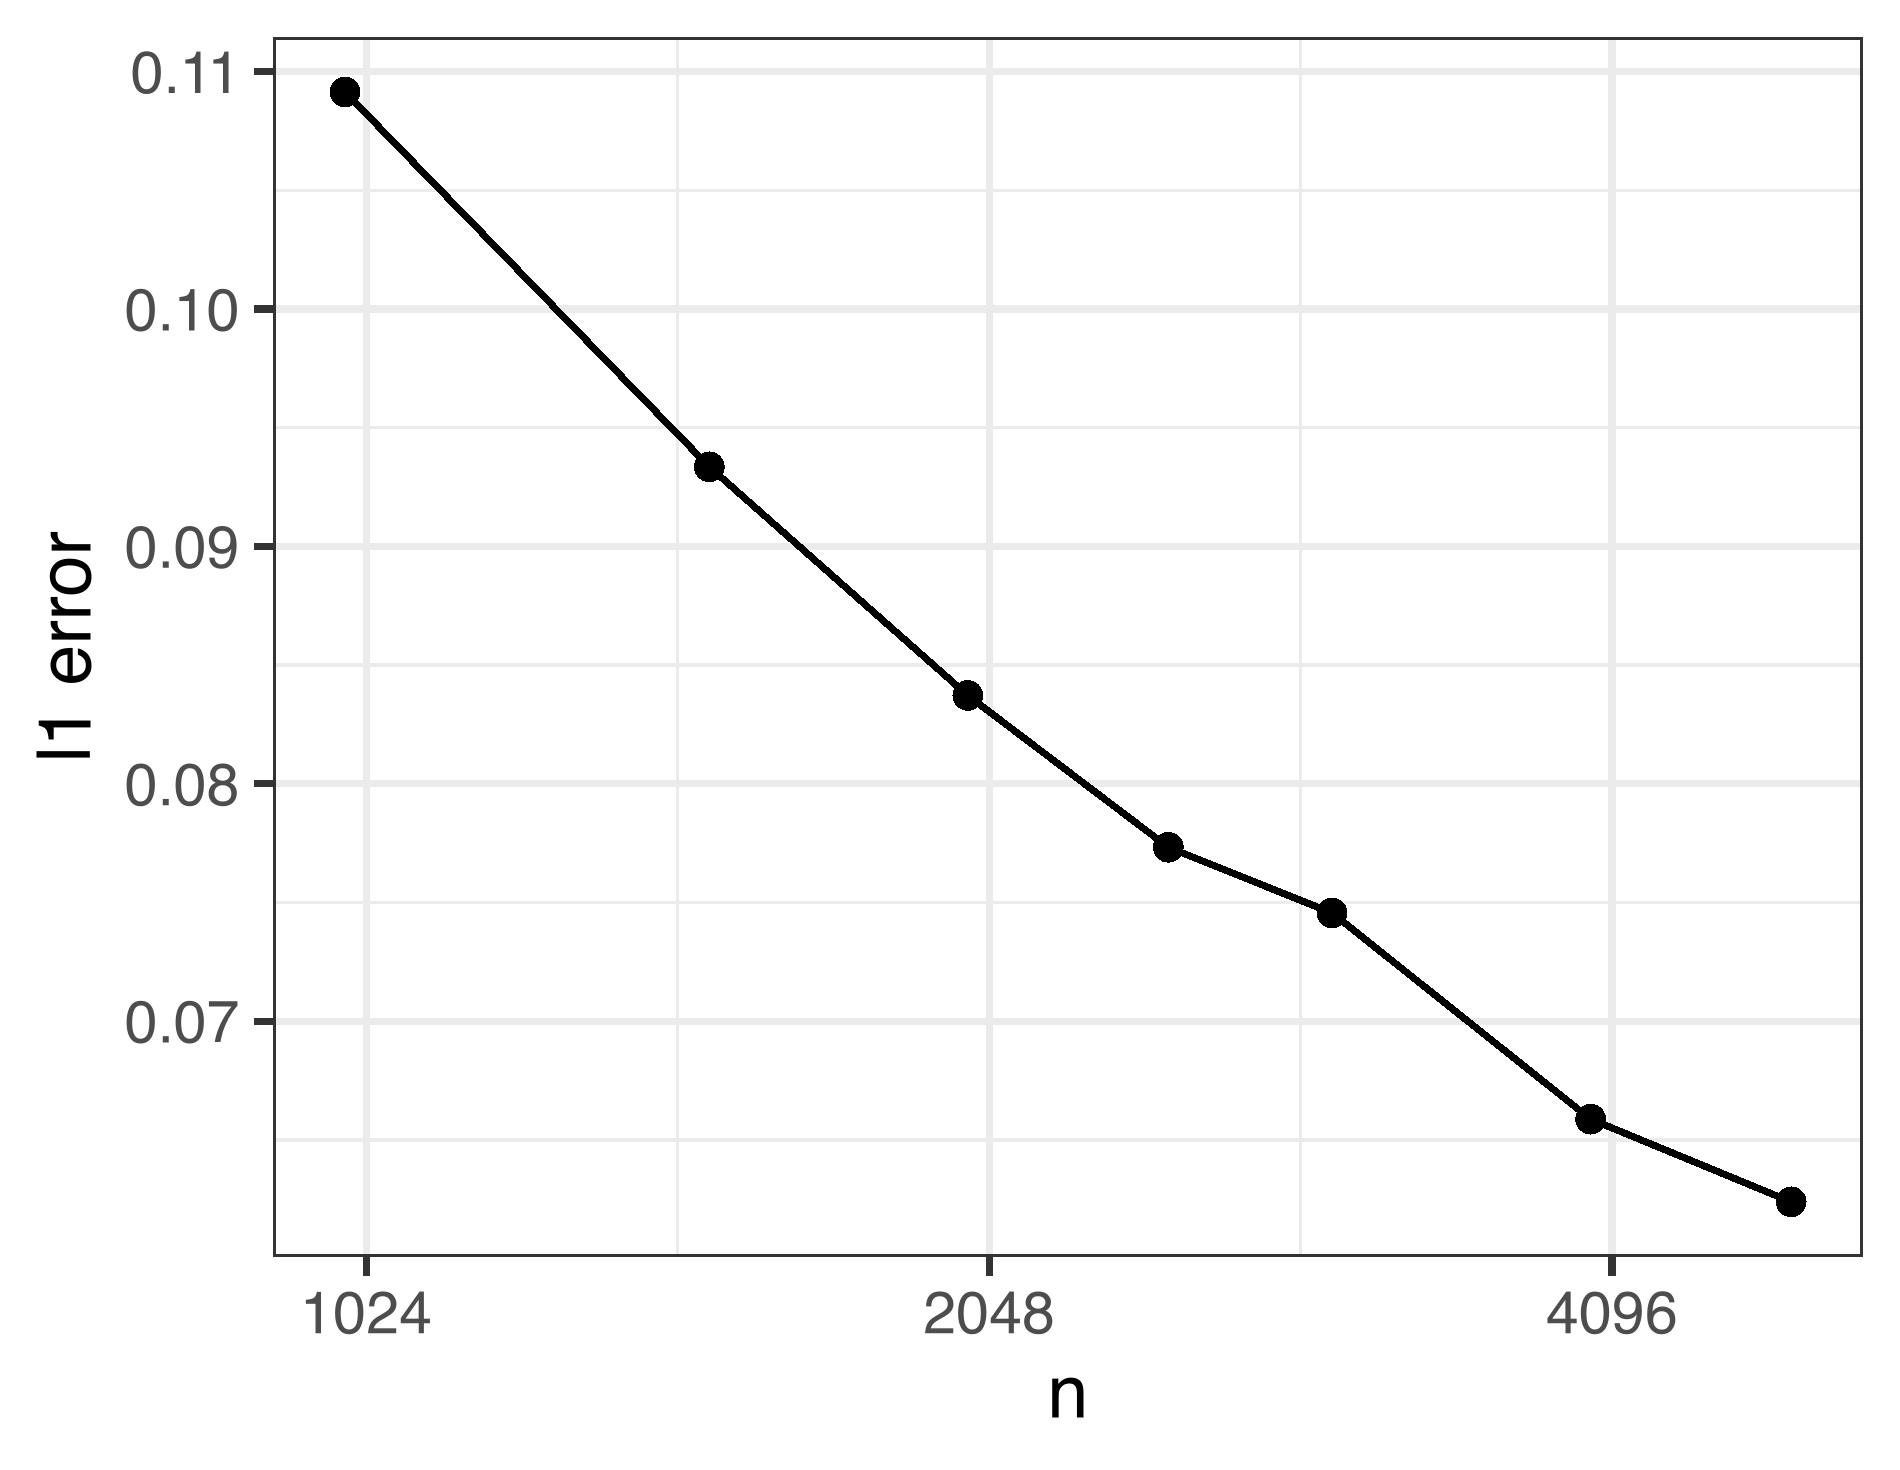
- **X-axis**: Labeled as `n` with tick marks at values:
`1024`, `2048`, `4096`.
- **Y-axis**: Labeled as `L1 error` with tick marks at values:
`0.07`, `0.08`, `0.09`, `0.10`, `0.11`.
## 2. **Data Points and Line Characteristics**
- **Line Type**: A single straight, downward-sloping line.
- **Data Points**:
- `(1024, 0.11)`
- `(2048, 0.095)`
- `(3072, 0.085)`
- `(4096, 0.075)`
- `(4096, 0.065)`
- *Note*: The fifth data point at `n=4096` appears to be plotted at `y=0.065`, which is below the lowest labeled y-axis value (`0.07`). This may indicate an extension of the y-axis range or a data inconsistency.
## 3. **Trend Verification**
- **Visual Trend**: The line exhibits a **linear decrease** in `L1 error` as `n` increases.
- **Slope Consistency**: The slope between consecutive data points is uniform, confirming a linear relationship.
- From `n=1024` to `n=2048`: Slope = `(0.095 - 0.11) / (2048 - 1024) = -0.00001328125`
- From `n=2048` to `n=3072`: Slope = `(0.085 - 0.095) / (3072 - 2048) = -0.000009765625`
- From `n=3072` to `n=4096`: Slope = `(0.075 - 0.085) / (4096 - 3072) = -0.0000104166667`
- *Note*: Minor variations in slope may arise from rounding in the data points.
## 4. **Legend and Color Analysis**
- **Legend**: No legend is present in the image.
- **Color Matching**: Not applicable (no legend to cross-reference).
## 5. **Component Isolation**
- **Header**: No explicit header (e.g., title) is visible.
- **Main Chart**:
- Axes with labeled ticks.
- Data points connected by a straight line.
- **Footer**: No footer elements present.
## 6. **Spatial Grounding**
- **Legend Position**: Not applicable (no legend).
- **Data Point Placement**:
- All data points align with their respective `n` and `L1 error` values on the axes.
## 7. **Textual Information**
- **Embedded Text**:
- Axis labels: `n` (x-axis), `L1 error` (y-axis).
- No additional text or annotations in the image.
## 8. **Conclusion**
The graph illustrates a **linear relationship** between `n` and `L1 error`, with `L1 error` decreasing as `n` increases. The absence of a legend and the potential inconsistency in the fifth data point (`n=4096, y=0.065`) warrant further verification of the data source or axis scaling.