## Map: Paris Stations and Areas
### Overview
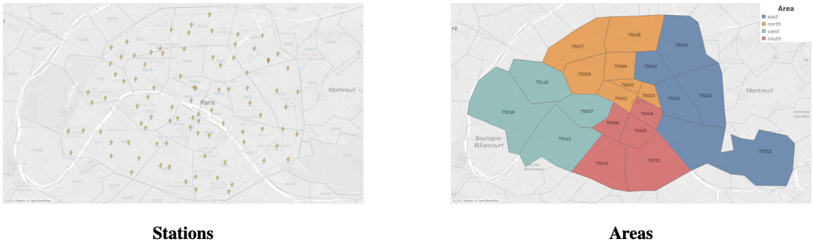
The image presents two maps of Paris. The left map shows the distribution of stations across the city, while the right map divides Paris into areas labeled as east, north, west, and south.
### Components/Axes
**Left Map (Stations):**
* **Title:** Stations
* **Content:** A map of Paris with numerous station markers (approximately 50-60) scattered across the city. The city's name "Paris" is labeled near the center. The stations are represented by a golden-brown icon resembling a location pin.
**Right Map (Areas):**
* **Title:** Areas
* **Legend (Top-Right):**
* east (blue)
* north (orange)
* west (teal)
* south (red)
* **Content:** A map of Paris divided into colored areas, each corresponding to a cardinal direction as indicated in the legend. Each area is labeled with a number starting with "750".
### Detailed Analysis or Content Details
**Left Map (Stations):**
* The station markers are densely concentrated in the central area of Paris.
* The distribution appears relatively even across the central region, with some stations located near the river.
* The number of stations is approximately 50-60.
**Right Map (Areas):**
* The "east" area (blue) covers the eastern part of Paris, including areas labeled "75011", "75012", and "75020".
* The "north" area (orange) covers the northern part of Paris, including areas labeled "75017", "75018", and "75009".
* The "west" area (teal) covers the western part of Paris, including areas labeled "75008", "75016", and "75007".
* The "south" area (red) covers the southern part of Paris, including areas labeled "75014", "75015", and "75005".
* The areas are divided into smaller numbered sections, presumably representing districts or neighborhoods.
### Key Observations
* The station distribution map provides a visual representation of station density across Paris.
* The area map divides Paris into four cardinal regions, each with distinct numbered sections.
* The legend clearly associates each cardinal direction with a specific color.
### Interpretation
The maps provide a geographical overview of Paris, highlighting the distribution of stations and the division of the city into cardinal areas. The station map could be used to analyze station density and accessibility, while the area map could be used for regional analysis or planning purposes. The combination of both maps could be used to understand the relationship between station distribution and regional divisions.