# Technical Document Extraction: Diagram Analysis
## Overview
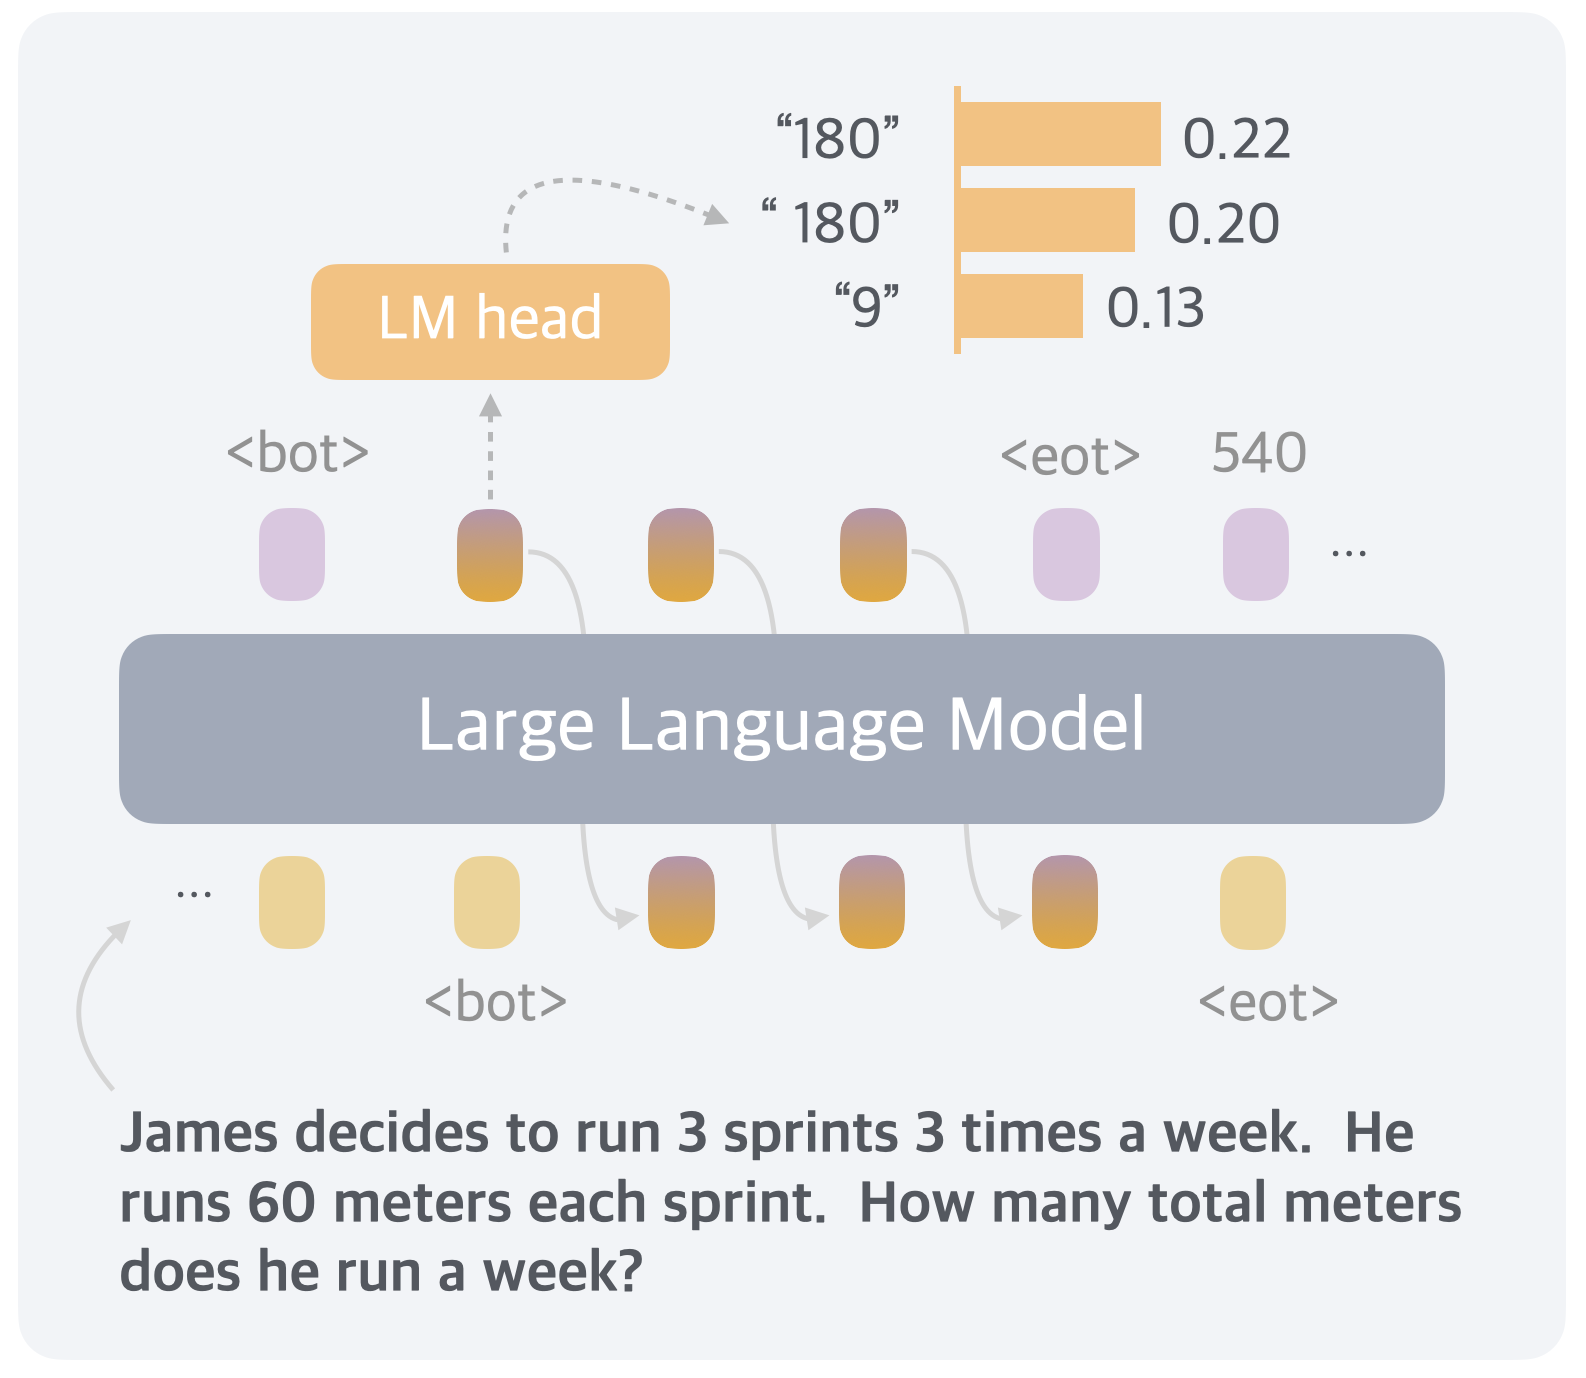
The image depicts a technical diagram illustrating components of a Large Language Model (LLM) system, including a bar chart visualization, a flow diagram of model components, and a textual math problem. The diagram uses color-coded elements to represent different data points and processes.
---
## 1. Bar Chart Component
### Structure
- **X-Axis Labels**: `"180"`, `"180"`, `"9"`
- **Y-Axis Values**: `0.22`, `0.20`, `0.13`
- **Legend**: Located on the right side of the chart, with three orange bars corresponding to the X-axis labels.
### Data Points
| X-Axis Label | Y-Axis Value | Color |
|--------------|--------------|--------|
| "180" | 0.22 | Orange |
| "180" | 0.20 | Orange |
| "9" | 0.13 | Orange |
### Trends
- The bar chart shows a **decreasing trend** in Y-axis values as X-axis labels decrease from "180" to "9".
---
## 2. Large Language Model (LLM) Flow Diagram
### Components
- **LM Head**: A central orange block labeled "LM head" with a dashed arrow pointing to the bar chart.
- **Colored Ovals**:
- **Purple**: Labeled `<bot>` (beginning of text) and `<eot>` (end of text).
- **Orange**: Intermediate processing nodes.
- **Yellow**: Additional nodes.
- **Arrows**: Indicate directional flow between components (e.g., `<bot>` → orange ovals → `<eot>`).
### Spatial Grounding
- **Legend**: Not explicitly labeled for ovals, but colors correspond to:
- Purple: `<bot>` and `<eot>`
- Orange: Intermediate nodes
- Yellow: Additional nodes
### Textual Elements
- **Embedded Text**:
- `<bot>` (beginning of text)
- `<eot>` (end of text)
- Numerical value: `540` (possibly representing token count or processing steps).
---
## 3. Textual Math Problem
### Content
> "James decides to run 3 sprints 3 times a week. He runs 60 meters each sprint. How many total meters does he run a week?"
### Analysis
- **Problem Type**: Arithmetic calculation.
- **Key Values**:
- Sprints per session: `3`
- Sessions per week: `3`
- Meters per sprint: `60`
- **Calculation**: