## Diagram: Human Pose Estimation Pipeline
### Overview
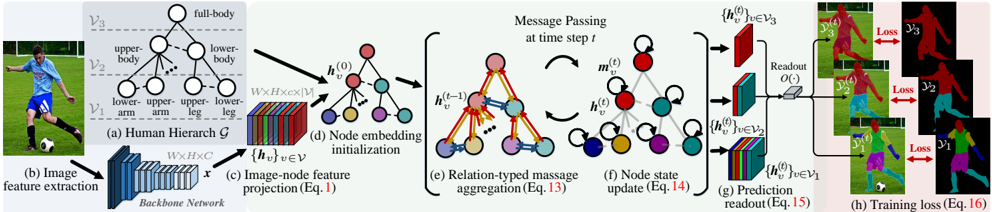
The image illustrates a pipeline for human pose estimation using a hierarchical graph-based approach. It starts with image feature extraction, projects these features onto a human hierarchy graph, performs message passing on the graph, and finally predicts the pose and calculates the training loss.
### Components/Axes
* **(a) Human Hierarchy G:** A hierarchical graph representing the human body. It has three levels:
* V3: full-body
* V2: upper-body, lower-body
* V1: lower-arm, upper-arm, upper-leg, lower-leg
* **(b) Image feature extraction:** An image of a person playing soccer is fed into a backbone network.
* **(c) Image-node feature projection (Eq. 1):** The extracted features (x) are projected to node features {h\_v}, where v belongs to V. The dimensions are WxHxC.
* **(d) Node embedding initialization:** The initial node embeddings h\_v^(0) are created.
* **(e) Relation-typed message aggregation (Eq. 13):** Messages are passed between nodes based on their relationships. The node embeddings at time t-1, h\_v^(t-1), are used to aggregate messages.
* **(f) Node state update (Eq. 14):** The node states h\_v^(t) are updated based on the aggregated messages m\_v^(t).
* **(g) Prediction readout (Eq. 15):** The node states at different levels of the hierarchy {h\_v^(t)}, where v belongs to V3, V2, and V1, are used to predict the pose through a readout function O().
* **(h) Training loss (Eq. 16):** The predicted pose is compared to the ground truth, and a loss is calculated for each level of the hierarchy (y3, y2, y1).
### Detailed Analysis
* **Human Hierarchy (a):** The human body is represented as a tree-like structure. The root node represents the full body, which is then divided into upper and lower body. These are further divided into limbs (lower-arm, upper-arm, upper-leg, lower-leg).
* **Image Feature Extraction (b):** A convolutional neural network (Backbone Network) extracts features from the input image.
* **Image-node feature projection (c):** The extracted image features are projected onto the nodes of the human hierarchy graph. The dimensions of the feature representation are W x H x C x |V|.
* **Node embedding initialization (d):** Each node in the graph is initialized with an embedding vector h\_v^(0).
* **Relation-typed message aggregation (e):** Nodes exchange messages with their neighbors based on the relationships defined in the hierarchy. The arrows indicate the direction of message passing.
* **Node state update (f):** Each node updates its state based on the received messages. Self-loops indicate that the node also considers its previous state.
* **Prediction readout (g):** The final node states are used to predict the pose. The readout function O() takes the node states from different levels of the hierarchy as input.
* **Training loss (h):** The predicted pose is compared to the ground truth pose, and a loss is calculated. The loss is computed at each level of the hierarchy (V3, V2, V1).
### Key Observations
* The pipeline uses a hierarchical graph to represent the human body, which allows for structured reasoning about the pose.
* Message passing is used to propagate information between nodes in the graph.
* The loss is computed at multiple levels of the hierarchy, which encourages the model to learn a consistent representation of the pose.
### Interpretation
The diagram illustrates a sophisticated approach to human pose estimation that leverages a hierarchical graph structure. By representing the human body as a graph and using message passing, the model can effectively reason about the relationships between different body parts. The multi-level loss function ensures that the model learns a consistent and accurate representation of the pose. This approach is likely to be more robust to occlusions and variations in pose compared to traditional methods. The use of a backbone network for feature extraction allows the model to leverage pre-trained knowledge from large image datasets.