\n
## Diagram: Human Pose Estimation Pipeline
### Overview
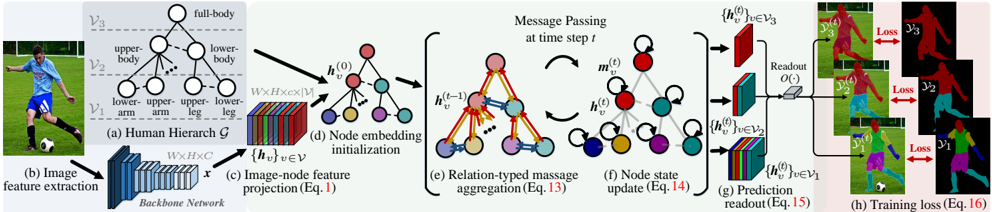
This diagram illustrates a pipeline for human pose estimation, likely using a graph neural network approach. It depicts the process from image input to pose prediction and loss calculation. The diagram is segmented into eight stages labeled (a) through (h), showing the flow of information and transformations.
### Components/Axes
The diagram consists of the following components:
* **(a) Human Hierarchy G:** A hierarchical representation of the human body, with nodes representing body parts (V1, V2, V3) and connections defining relationships.
* **(b) Image feature extraction:** A convolutional neural network (Backbone Network) processing an input image.
* **(c) Image-node feature projection:** A transformation of image features (x) into node features (h(t)v ∈ V).
* **(d) Node embedding initialization:** Initializing node embeddings.
* **(e) Relation-typed message aggregation:** Aggregating messages between nodes based on their relationships.
* **(f) Node state update:** Updating node states based on aggregated messages.
* **(g) Prediction readout:** Generating pose predictions from node features.
* **(h) Training loss:** Calculating the loss between predicted and ground truth poses.
The diagram also includes equations referenced in parentheses below each stage.
### Detailed Analysis or Content Details
**(a) Human Hierarchy G:**
The human hierarchy is represented as a tree structure.
* V1 (lower level): Contains nodes for lower arm, lower leg, and foot.
* V2 (mid level): Contains nodes for upper arm, upper leg, and torso.
* V3 (highest level): Contains a node for the full body.
The connections between nodes represent anatomical relationships.
**(b) Image feature extraction:**
The input image is processed by a "Backbone Network" which outputs a feature map with dimensions W x H x C.
**(c) Image-node feature projection:**
The image features (x) are projected into node features (h(t)v ∈ V) using an equation (Eq. 1).
**(d) Node embedding initialization:**
Node embeddings are initialized. The diagram shows a 3D tensor representing the node features.
**(e) Relation-typed message aggregation:**
Messages are aggregated between nodes based on their relationships. The diagram shows colored arrows representing message passing between nodes. Orange arrows indicate messages from lower-level nodes to higher-level nodes, while blue arrows indicate messages between nodes at the same level.
**(f) Node state update:**
Node states are updated based on the aggregated messages. The diagram shows a circular arrow indicating the update process.
**(g) Prediction readout:**
Node features are used to generate pose predictions. The diagram shows a "Readout" block that transforms node features into pose predictions.
**(h) Training loss:**
The loss between predicted poses (p1) and ground truth poses (V3) is calculated. The diagram shows three examples of pose predictions and their corresponding loss values (Loss 31, Loss 32, Loss 33). Red arrows indicate the direction of the loss calculation.
### Key Observations
* The pipeline utilizes a hierarchical representation of the human body.
* Message passing between nodes is relation-typed, meaning the messages are aggregated differently based on the relationships between nodes.
* The pipeline is trained using a loss function that compares predicted poses to ground truth poses.
* The diagram emphasizes the flow of information from image features to pose predictions.
* The use of equations suggests a mathematical formulation of the pipeline.
### Interpretation
This diagram describes a graph neural network-based approach to human pose estimation. The hierarchical representation of the human body allows the network to capture anatomical relationships and dependencies. The message passing mechanism enables information exchange between body parts, leading to more accurate pose predictions. The loss function guides the training process, ensuring that the network learns to predict poses that are consistent with the ground truth. The overall pipeline demonstrates a sophisticated approach to human pose estimation that leverages the power of graph neural networks and hierarchical representations. The diagram suggests a focus on capturing the relationships between body parts to improve the accuracy of pose estimation. The use of equations indicates a rigorous mathematical foundation for the pipeline. The diagram is a high-level overview of the pipeline and does not provide details about the specific network architecture or training procedure.