## Chart: Learning Curves for Generation and Self-Verification
### Overview
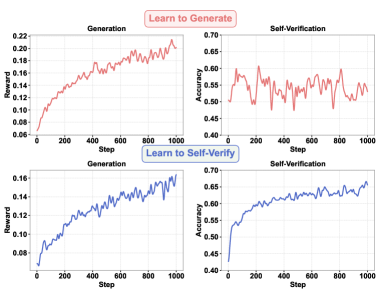
The image presents four line graphs, arranged in a 2x2 grid, illustrating the learning curves for two processes: "Learn to Generate" and "Learn to Self-Verify." Each process has two graphs: one showing the reward/accuracy achieved during the "Generation" phase and the other showing the reward/accuracy achieved during the "Self-Verification" phase. The x-axis represents the "Step" (presumably training steps), ranging from 0 to 1000. The y-axes represent "Reward" for the Generation graphs and "Accuracy" for the Self-Verification graphs.
### Components/Axes
* **Titles:**
* Top Row: "Learn to Generate"
* Left: "Generation"
* Right: "Self-Verification"
* Bottom Row: "Learn to Self-Verify"
* Left: "Generation"
* Right: "Self-Verification"
* **X-Axis:** "Step" (0 to 1000 in increments of 200)
* **Y-Axis (Left Column):** "Reward"
* Top Left: 0.06 to 0.22 in increments of 0.02
* Bottom Left: 0.08 to 0.16 in increments of 0.02
* **Y-Axis (Right Column):** "Accuracy"
* Top Right: 0.40 to 0.70 in increments of 0.05
* Bottom Right: 0.40 to 0.70 in increments of 0.05
* **Data Series Colors:**
* "Learn to Generate" (Top Row): Red
* "Learn to Self-Verify" (Bottom Row): Blue
### Detailed Analysis
**Top Row: Learn to Generate (Red Lines)**
* **Generation (Top Left):**
* Trend: The reward generally increases with steps.
* Data Points: Starts around 0.06 at step 0, rises to approximately 0.14 by step 200, reaches around 0.17 by step 400, and plateaus around 0.20-0.22 by step 800-1000.
* **Self-Verification (Top Right):**
* Trend: The accuracy fluctuates but generally remains stable.
* Data Points: Starts around 0.50 at step 0, fluctuates between 0.50 and 0.60 throughout the steps, with no clear upward or downward trend.
**Bottom Row: Learn to Self-Verify (Blue Lines)**
* **Generation (Bottom Left):**
* Trend: The reward increases with steps.
* Data Points: Starts around 0.08 at step 0, rises to approximately 0.12 by step 400, and reaches around 0.15-0.16 by step 1000.
* **Self-Verification (Bottom Right):**
* Trend: The accuracy increases with steps.
* Data Points: Starts around 0.42 at step 0, rises to approximately 0.55 by step 200, and reaches around 0.65 by step 1000.
### Key Observations
* In "Learn to Generate," the reward increases significantly during the generation phase, but the accuracy in self-verification remains relatively stable.
* In "Learn to Self-Verify," both the reward in the generation phase and the accuracy in the self-verification phase increase with steps.
* The "Learn to Self-Verify" process shows a more consistent improvement in both reward and accuracy compared to the "Learn to Generate" process.
### Interpretation
The graphs suggest that the "Learn to Self-Verify" process is more effective in improving both the generation and self-verification aspects compared to the "Learn to Generate" process. The "Learn to Generate" process seems to improve the reward during generation but does not significantly impact the accuracy of self-verification. This could indicate that the model trained to generate is not effectively learning to verify its own outputs, while the model trained to self-verify is improving in both generating and verifying. The data implies that self-verification is a more robust learning strategy in this context.