## Line Charts: Training Performance Comparison
### Overview
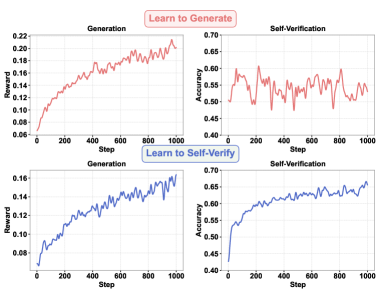
The image presents a 2x2 grid of line charts comparing the performance of two training approaches: "Learn to Generate" (top row) and "Learn to Self-Verify" (bottom row). Each approach is evaluated based on two metrics: "Reward" (left column) and "Accuracy" (right column). The x-axis of all charts represents "Step" (ranging from 0 to 1000), indicating the training iteration.
### Components/Axes
* **X-axis (all charts):** "Step" - Scale from 0 to 1000, with tick marks at intervals of 100.
* **Y-axis (top-left & bottom-left charts):** "Reward" - Scale from 0.05 to 0.22 (top-left) and 0.07 to 0.16 (bottom-left).
* **Y-axis (top-right & bottom-right charts):** "Accuracy" - Scale from 0.40 to 0.70.
* **Line Colors:** Red represents "Learn to Generate", Blue represents "Learn to Self-Verify".
* **Titles:** "Generation" (top-left & bottom-left), "Self-Verification" (top-right & bottom-right).
* **Overall Titles:** "Learn to Generate" (top row), "Learn to Self-Verify" (bottom row).
### Detailed Analysis or Content Details
**Top-Left Chart: Learn to Generate - Reward**
* The red line representing "Learn to Generate" shows an upward trend initially, then plateaus with fluctuations.
* Approximate data points:
* Step 0: Reward ≈ 0.07
* Step 200: Reward ≈ 0.14
* Step 400: Reward ≈ 0.17
* Step 600: Reward ≈ 0.19
* Step 800: Reward ≈ 0.20
* Step 1000: Reward ≈ 0.21
**Top-Right Chart: Learn to Generate - Accuracy**
* The red line representing "Learn to Generate" exhibits significant fluctuations throughout the training process, with no clear upward or downward trend.
* Approximate data points:
* Step 0: Accuracy ≈ 0.62
* Step 200: Accuracy ≈ 0.50
* Step 400: Accuracy ≈ 0.65
* Step 600: Accuracy ≈ 0.55
* Step 800: Accuracy ≈ 0.58
* Step 1000: Accuracy ≈ 0.56
**Bottom-Left Chart: Learn to Self-Verify - Reward**
* The blue line representing "Learn to Self-Verify" shows a consistent upward trend, though the rate of increase slows down over time.
* Approximate data points:
* Step 0: Reward ≈ 0.08
* Step 200: Reward ≈ 0.11
* Step 400: Reward ≈ 0.13
* Step 600: Reward ≈ 0.14
* Step 800: Reward ≈ 0.15
* Step 1000: Reward ≈ 0.15
**Bottom-Right Chart: Learn to Self-Verify - Accuracy**
* The blue line representing "Learn to Self-Verify" demonstrates a clear and consistent upward trend, indicating improving accuracy with increasing training steps.
* Approximate data points:
* Step 0: Accuracy ≈ 0.45
* Step 200: Accuracy ≈ 0.55
* Step 400: Accuracy ≈ 0.62
* Step 600: Accuracy ≈ 0.66
* Step 800: Accuracy ≈ 0.68
* Step 1000: Accuracy ≈ 0.69
### Key Observations
* "Learn to Self-Verify" consistently achieves higher accuracy than "Learn to Generate".
* "Learn to Generate" initially shows faster reward gains, but plateaus, while "Learn to Self-Verify" has slower but more sustained reward improvement.
* The accuracy of "Learn to Generate" is highly volatile, suggesting instability in the training process.
* "Learn to Self-Verify" exhibits a stable and positive correlation between training steps and accuracy.
### Interpretation
The data suggests that "Learn to Self-Verify" is a more effective training approach than "Learn to Generate" in terms of achieving higher and more stable accuracy. While "Learn to Generate" may offer quicker initial reward gains, its fluctuating accuracy and eventual plateau indicate potential issues with convergence or generalization. The consistent upward trend in accuracy for "Learn to Self-Verify" suggests a more robust and reliable learning process. The difference in performance could be attributed to the self-verification mechanism providing a more informative signal for learning, leading to better generalization and stability. The volatility in "Learn to Generate" accuracy might indicate overfitting or sensitivity to the training data. The charts provide a clear visual comparison of the two methods, highlighting the benefits of incorporating self-verification into the training process.